Unlock a world of possibilities! Login now and discover the exclusive benefits awaiting you.
- Qlik Community
- :
- All Forums
- :
- QlikView App Dev
- :
- Sum for different months
- Subscribe to RSS Feed
- Mark Topic as New
- Mark Topic as Read
- Float this Topic for Current User
- Bookmark
- Subscribe
- Mute
- Printer Friendly Page
- Mark as New
- Bookmark
- Subscribe
- Mute
- Subscribe to RSS Feed
- Permalink
- Report Inappropriate Content
Sum for different months
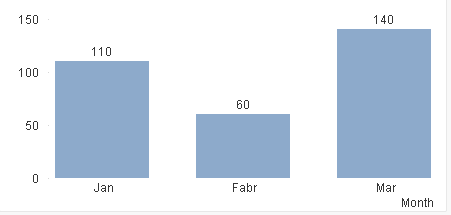
Hello everybody! I have this kind of table
Months Sales
January 50
January 60
Fabruary 60
March 100
March 10
March 30
I would like to a have a stacked column chart that shows the sum of sales per month. If I use sum (Sales) I'll have 310, instead I would like to have Jan 110, Fabr 160 etc.
Thank you very much!
- « Previous Replies
-
- 1
- 2
- Next Replies »
Accepted Solutions
- Mark as New
- Bookmark
- Subscribe
- Mute
- Subscribe to RSS Feed
- Permalink
- Report Inappropriate Content
OK so I thought about it for a second and made the attached which is what you want I believe. 
This time it uses "Year" for the stacked bar and "Month" for the data segments
- Mark as New
- Bookmark
- Subscribe
- Mute
- Subscribe to RSS Feed
- Permalink
- Report Inappropriate Content
Why Fabruary 160?? Can you make clear output?
- Mark as New
- Bookmark
- Subscribe
- Mute
- Subscribe to RSS Feed
- Permalink
- Report Inappropriate Content
>>instead I would like to have Jan 110, Fabr 160 etc.
If you use Months as a dimension and Sum(Sales) as the measure, that's precisely what you will get.
Edit: assuming Feb is missing a line...
- Mark as New
- Bookmark
- Subscribe
- Mute
- Subscribe to RSS Feed
- Permalink
- Report Inappropriate Content
Addition we need to add Month(Date#(Months,'MMM'))
- Mark as New
- Bookmark
- Subscribe
- Mute
- Subscribe to RSS Feed
- Permalink
- Report Inappropriate Content
Hi Jonathan! Sorry, yes the output was 160. I would like to have one bar with all the monthly misures on one bar, so I can't put the month for dimension.
Thank you.
- Mark as New
- Bookmark
- Subscribe
- Mute
- Subscribe to RSS Feed
- Permalink
- Report Inappropriate Content
Are you not looking this? If not, Can you make paper diagram
- Mark as New
- Bookmark
- Subscribe
- Mute
- Subscribe to RSS Feed
- Permalink
- Report Inappropriate Content
Try the attached QVW
- Mark as New
- Bookmark
- Subscribe
- Mute
- Subscribe to RSS Feed
- Permalink
- Report Inappropriate Content
- Mark as New
- Bookmark
- Subscribe
- Mute
- Subscribe to RSS Feed
- Permalink
- Report Inappropriate Content
Hi Anna, you just need to set the style in your chart as stacked and add a second dimension for month. Maybe if you post your application it would be easier to help
- Mark as New
- Bookmark
- Subscribe
- Mute
- Subscribe to RSS Feed
- Permalink
- Report Inappropriate Content
Stacked bar charts need either; two dimensions, one expressions OR one dimension, multiple expressions.
I have attached an example where I added a new field "Year" and have 2 years of data. the stacked chart now shows the 2 years figures combined in a stacked chart.
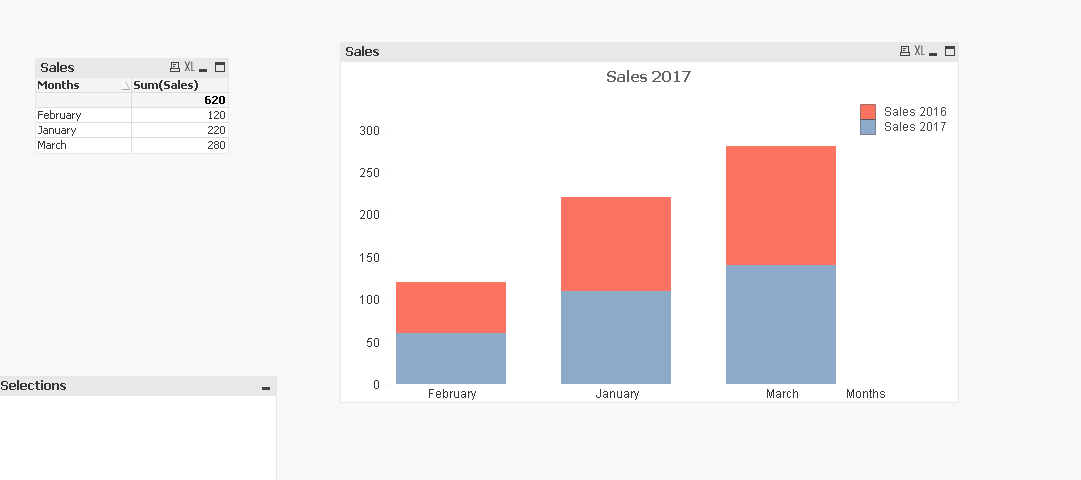
- « Previous Replies
-
- 1
- 2
- Next Replies »