Unlock a world of possibilities! Login now and discover the exclusive benefits awaiting you.
- Qlik Community
- :
- All Forums
- :
- QlikView App Dev
- :
- Comparsion of sales in stack bar chart
- Subscribe to RSS Feed
- Mark Topic as New
- Mark Topic as Read
- Float this Topic for Current User
- Bookmark
- Subscribe
- Mute
- Printer Friendly Page
- Mark as New
- Bookmark
- Subscribe
- Mute
- Subscribe to RSS Feed
- Permalink
- Report Inappropriate Content
Comparsion of sales in stack bar chart
Hi All,
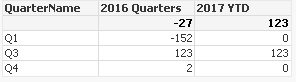
Is it possible to compare sales of 2016 quarters with 2017 quarters in stack bar chart? But 2017 quarters must be always YTD sales.
Today : 27/07/2017
Ex: Q1 2016 - Jan, Feb, Mar of 2016. But Q12017 should be entire sales of 2017 upto today.
same applies for Q2 2016 - Apr, May, Jun of 2016 but Q2 2017 should be entire sales of 2017 upto today. same applies for Q3 and Q4 as well
Is it possible to achieve this? Thanks to advice
Regards,
Krishna
- Tags:
- rahul pawar
- « Previous Replies
- Next Replies »
- Mark as New
- Bookmark
- Subscribe
- Mute
- Subscribe to RSS Feed
- Permalink
- Report Inappropriate Content
Yes, We can achieve same. Will you able to provide sample data set
- Mark as New
- Bookmark
- Subscribe
- Mute
- Subscribe to RSS Feed
- Permalink
- Report Inappropriate Content
Anil,
Data file for two years is really huge. i am unable to attach it. Please advice me how to achieve this.
Regards,
Krishna
- Mark as New
- Bookmark
- Subscribe
- Mute
- Subscribe to RSS Feed
- Permalink
- Report Inappropriate Content
Hi Anil,
Could you suggest me or explain me logic to achieve this.
- Mark as New
- Bookmark
- Subscribe
- Mute
- Subscribe to RSS Feed
- Permalink
- Report Inappropriate Content
Don' require to share whole rows. Atleast 5 Rows for each Quarter from 2016 and 2017. In fact, This may helps you rather wasting your time and my time too
- Mark as New
- Bookmark
- Subscribe
- Mute
- Subscribe to RSS Feed
- Permalink
- Report Inappropriate Content
Please find attached data Anil. Thanks to advice
- Mark as New
- Bookmark
- Subscribe
- Mute
- Subscribe to RSS Feed
- Permalink
- Report Inappropriate Content
Thanks for that. And you have 3 date fields. Do i need to manipulate to single date field or what? Can you let us know where i need to look and which is Metric and Dimensions??
Better if you provide few lines of output expecting ?
- Mark as New
- Bookmark
- Subscribe
- Mute
- Subscribe to RSS Feed
- Permalink
- Report Inappropriate Content
Anil, Quarter and Year based on delivery date, For each dimension-customer(customer Key), sum of Delivered Qty required to compare. Thanks to advice.
- Mark as New
- Bookmark
- Subscribe
- Mute
- Subscribe to RSS Feed
- Permalink
- Report Inappropriate Content
May be attached
- Mark as New
- Bookmark
- Subscribe
- Mute
- Subscribe to RSS Feed
- Permalink
- Report Inappropriate Content
Hi Anil,
I want this output in bar chart. Please refer to the attachment.
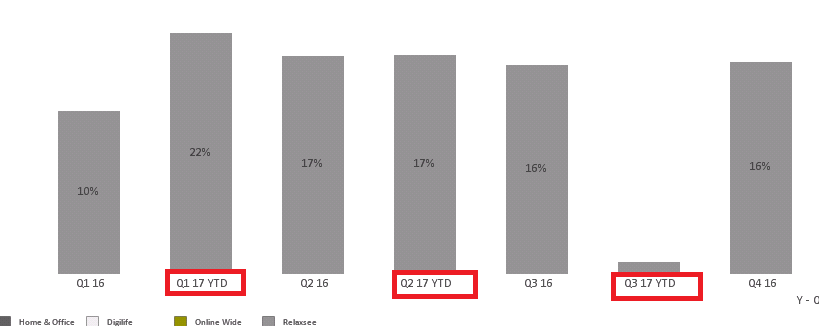
- « Previous Replies
- Next Replies »