Unlock a world of possibilities! Login now and discover the exclusive benefits awaiting you.
- Qlik Community
- :
- All Forums
- :
- QlikView App Dev
- :
- How to filter charts with different dimensions
- Subscribe to RSS Feed
- Mark Topic as New
- Mark Topic as Read
- Float this Topic for Current User
- Bookmark
- Subscribe
- Mute
- Printer Friendly Page
- Mark as New
- Bookmark
- Subscribe
- Mute
- Subscribe to RSS Feed
- Permalink
- Report Inappropriate Content
How to filter charts with different dimensions
Hi,
I have 4 charts which are having different dimensions, If i am trying to filter those charts am not able to do so because of the different dimensions. Could you suggest how to proceed further.Please find attached the screen-print.Kindly reply as soon as you could.
Thanks in advance...
- Mark as New
- Bookmark
- Subscribe
- Mute
- Subscribe to RSS Feed
- Permalink
- Report Inappropriate Content
Nithya,
Can you provide a little more information. The question you posed is not totally clear.
With Qlik's associative model if you filter a selection the charts should display data accordingly.
Thanks
Oscar
- Mark as New
- Bookmark
- Subscribe
- Mute
- Subscribe to RSS Feed
- Permalink
- Report Inappropriate Content
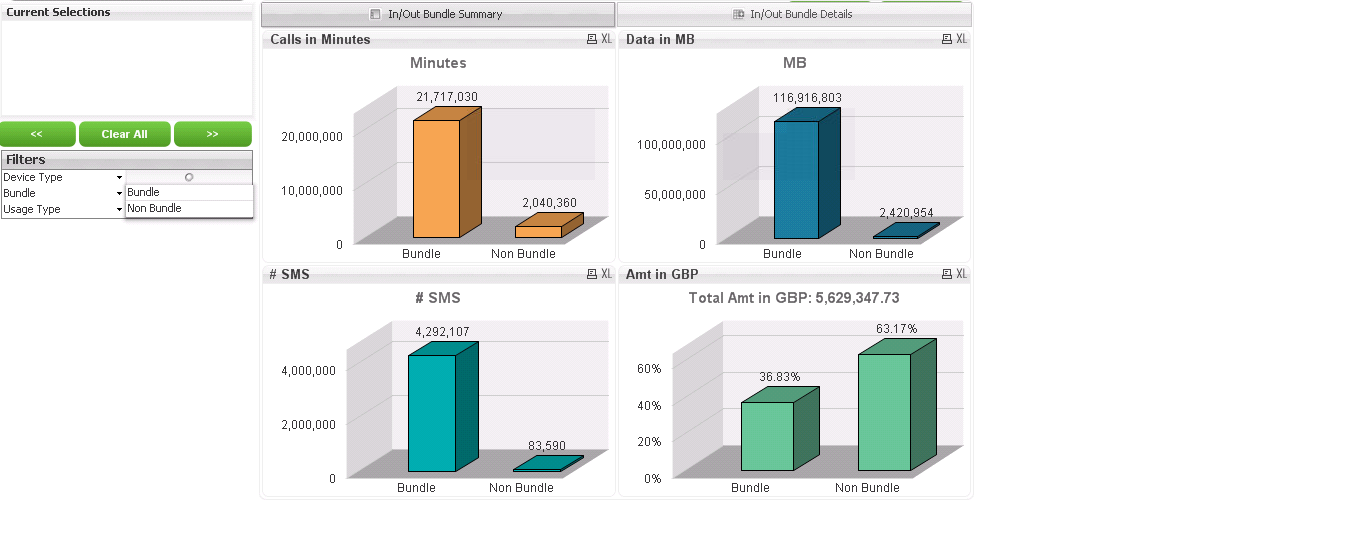
I have four different charts(see the attachment), where i have created those charts with 4 different fields, but in each and every field I have a two kinds of data i.e., Bundle and Non-Bundle.
Here i should have only one filter for selection called "IN-OUT Bundle" which have Bundle and Non-Bundle.
So when i choose Bundle (in "IN-OUT Bundle" filter) the four charts should show only bundle related data.
for eg:- Calls - Bundle
SMS - Bundle
Data in MB - Bundle
Total Amount - Bundle
- Mark as New
- Bookmark
- Subscribe
- Mute
- Subscribe to RSS Feed
- Permalink
- Report Inappropriate Content
Hi Oscar,
Could you please reply an answer ASAP.
Thanks in advance
- Mark as New
- Bookmark
- Subscribe
- Mute
- Subscribe to RSS Feed
- Permalink
- Report Inappropriate Content
Nithya,
How is the data related in the four different fields?
Do you have four tables being loaded Calls, SMS, Data, Total?
How is your data model prepared?
Do you have sample data that you can share?
I would need more information to understand the problem better so I can then come up with a solution.
Thanks
Oscar
- Mark as New
- Bookmark
- Subscribe
- Mute
- Subscribe to RSS Feed
- Permalink
- Report Inappropriate Content
Can you provide sample data, better to understand...!!
- Mark as New
- Bookmark
- Subscribe
- Mute
- Subscribe to RSS Feed
- Permalink
- Report Inappropriate Content
Nithya,
What currently happens when you select Bundle from your selection filters? Do the charts automatically adjust to the selection? I would assume so from just the image that you attached. If so then you don't have a problem the application is working as designed. If not well then I need to understand what the data looks like. That's why sample data would be important.
Thanks
Oscar
- Mark as New
- Bookmark
- Subscribe
- Mute
- Subscribe to RSS Feed
- Permalink
- Report Inappropriate Content
Thanks for your reply
The source is excel file.
In Excel we have some fields called classification, code, charges, TOTAL,Product
Based on the above fields we have created those 4 fields(Calls,SMS,DB and Amount) and using those 4 fields, i have created 4 charts(calls,SMS, DB and Amount - Please see attachment)
In each and every chart i have bundle and Non-Bundle data.
for example,
i will take SMS chart :-
SMS field created as if(TOTAL<>0 and CODE<>'111' and classification = 'messaging', 'Non Bundle','Bundle')
DB field created as if(WildMatch([Product],'*AA*','*A1*')=1 and classification = 'Data' ,'Non Bundle','Bundle')
and remaining 2 fields- call and total amt also created based on some other conditions and based on those fields i have created that 4 charts called calls,SMS, DB and Amount
now i need a Bundle/Non-bundle filter for selection, when i choose Bundle all the four charts should show only bundle related data.
Please help me to get this done.
Thanks in advance.
- Mark as New
- Bookmark
- Subscribe
- Mute
- Subscribe to RSS Feed
- Permalink
- Report Inappropriate Content
Ok, so then the next question I have is are you creating this in the script or are you creating calculated dimension. Ideally script is the place where you want to build your Bundle field. Now you may need to read through your script four times to get it just right.
Fact:
Load
'Calls' as Category,
Calls Bundle Criteria from above as Bundle
Value as Amount
From YourExcelTable;
Load
'SMS' as Category,
SMS Bundle Criteria from above as Bundle
Value as Amount
From YourExcelTable;
And so on until you have all four data types loaded.
Now your dimension in your chart can be Bundle and your expression will be vary similar and using set analysis you can filter your expression.
Sum( {< Category={'Calls'} >} Amount )
Sum( {< Category={'SMS'} >} Amount )
Now if you make a selection in the Bundle field and select "Bundle" then only Bundle bar will appear.
Hope this makes sense.
Good luck
Oscar
- Mark as New
- Bookmark
- Subscribe
- Mute
- Subscribe to RSS Feed
- Permalink
- Report Inappropriate Content
Nithya,
Not sure if you solved your issue. But if you have would you mind closing the thread.
Qlik Community Tip: Marking Replies as Correct or Helpful
Thanks
Oscar