Unlock a world of possibilities! Login now and discover the exclusive benefits awaiting you.
- Qlik Community
- :
- All Forums
- :
- QlikView App Dev
- :
- Weeks on Inventory Line Chart
- Subscribe to RSS Feed
- Mark Topic as New
- Mark Topic as Read
- Float this Topic for Current User
- Bookmark
- Subscribe
- Mute
- Printer Friendly Page
- Mark as New
- Bookmark
- Subscribe
- Mute
- Subscribe to RSS Feed
- Permalink
- Report Inappropriate Content
Weeks on Inventory Line Chart
Hello community,
I created a straight table to calculate the Inventory AMT, Inventory QTY, Run Rate and Weeks on Inventory (WOI). I’m getting the desired results on this table.
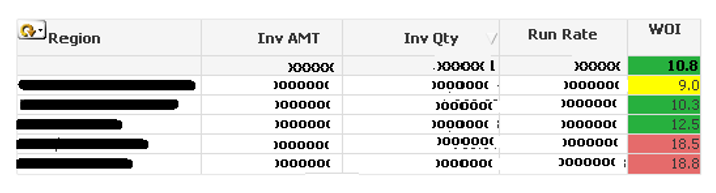
My expressions for the table are:
INV AMT:
SUM({$<YYYYQ=, YYYYWK={$(cLastYYYYWK)}>} InvAMT)
INV QTY:
SUM({$<YYYYQ=, YYYYWK={$(cLastYYYYWK)}>} InvQTY)
RUN RATE:
(sum({<YYYYQ=, YYYWK=,TRANSACTION_YYYYWK={">$(cLastWeek_Minus_1_Qtr_YYYYWK)"}>}ResaleQTY)/13)
WOI (AMT):
(Sum({<YYYYQ=, YYYYWK={$(cLastYYYYWK)}>})InvAMT) /
(sum({<YYYYQ=, YYYYWK=, PROCESS_YYYYWK={">$(cLastWeek_Minus_1_Qtr_YYYYWK)"}>}ResaleAMT)/13)
WOI (QTY):
[Inv Qty] / [Run Rate]
I have a requirement to display a line chart for the WOI measure and it should display results for the last 26 weeks $(cLastWeek_Minus_2_Qtr_YYYYWK) – see image below for sample requirement. Any ideas on how to achieve this using the same metrics?
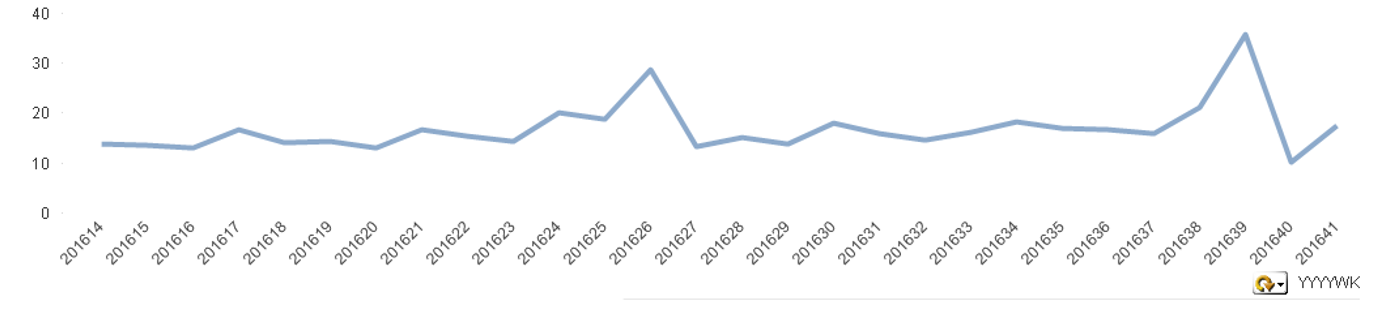
Thanks!
- Mark as New
- Bookmark
- Subscribe
- Mute
- Subscribe to RSS Feed
- Permalink
- Report Inappropriate Content
Hi,
You can create a mastercalendar in your datamodel having Weeks as desired and put that into you dimension.
to create a master calendar you can search community there are many post out there.. Master Calendar Generation Script
HTH
- Mark as New
- Bookmark
- Subscribe
- Mute
- Subscribe to RSS Feed
- Permalink
- Report Inappropriate Content
Try Like This, Field must be there
Week(DateField) as Week,
Expression:
SUM({$<Week = {'$(=WeekStart(Week,-26))'}, YYYYQ=, YYYYWK={$(cLastYYYYWK)}>} InvQTY)
/
sum({<Week = {'$(=WeekStart(Week,-26))'}, YYYYQ=, YYYWK=,TRANSACTION_YYYYWK={">$(cLastWeek_Minus_1_Qtr_YYYYWK)"}>}ResaleQTY)/13
- Mark as New
- Bookmark
- Subscribe
- Mute
- Subscribe to RSS Feed
- Permalink
- Report Inappropriate Content
- Mark as New
- Bookmark
- Subscribe
- Mute
- Subscribe to RSS Feed
- Permalink
- Report Inappropriate Content
Does Anil's solution work?
- Mark as New
- Bookmark
- Subscribe
- Mute
- Subscribe to RSS Feed
- Permalink
- Report Inappropriate Content
No, neither of the solutions recommended work. We already have a master calendar and a variable for the "week" field, still unable to create the line chart for Weeks on Inventory.
The app is very large in size, I'm trying to create a slim-down version so I can upload to the community.
Thanks,
Carlos
- Mark as New
- Bookmark
- Subscribe
- Mute
- Subscribe to RSS Feed
- Permalink
- Report Inappropriate Content
That is the best approach.
- Mark as New
- Bookmark
- Subscribe
- Mute
- Subscribe to RSS Feed
- Permalink
- Report Inappropriate Content
Sum({<DATE={">=$(=addweeks(weekend(today()),-26))<=$(=addweeks(weekend(today()),0))"}>}InvQTY)
Sub DATE for your date field.