Unlock a world of possibilities! Login now and discover the exclusive benefits awaiting you.
- Qlik Community
- :
- All Forums
- :
- QlikView App Dev
- :
- Bar Charts w/Stacked Bars
- Subscribe to RSS Feed
- Mark Topic as New
- Mark Topic as Read
- Float this Topic for Current User
- Bookmark
- Subscribe
- Mute
- Printer Friendly Page
- Mark as New
- Bookmark
- Subscribe
- Mute
- Subscribe to RSS Feed
- Permalink
- Report Inappropriate Content
Bar Charts w/Stacked Bars
I'm creating a chart with two dimensions (Year and Month) with multiple expressions (Revenue, Margin, Expenses, etc.) and I've chosen to use a bar chart object. The result chart is stacking the bar with the multiple expression values. Is there any way to avoid this while keeping the multiple dimensions? Thank you in advance.
Accepted Solutions
- Mark as New
- Bookmark
- Subscribe
- Mute
- Subscribe to RSS Feed
- Permalink
- Report Inappropriate Content
Do you use those two dimensions because you want to see YearMonth like Jan 2016, Feb 2016 etc.
create a YearMonth in your script and use that as a single dimension.
- Mark as New
- Bookmark
- Subscribe
- Mute
- Subscribe to RSS Feed
- Permalink
- Report Inappropriate Content
Are you talking about QlikView or Qlik Sense (as you did not post this in the correct category)?
Let me know so we can move it to the right spot.
- Mark as New
- Bookmark
- Subscribe
- Mute
- Subscribe to RSS Feed
- Permalink
- Report Inappropriate Content
I'm using QlikView v11.2
- Mark as New
- Bookmark
- Subscribe
- Mute
- Subscribe to RSS Feed
- Permalink
- Report Inappropriate Content
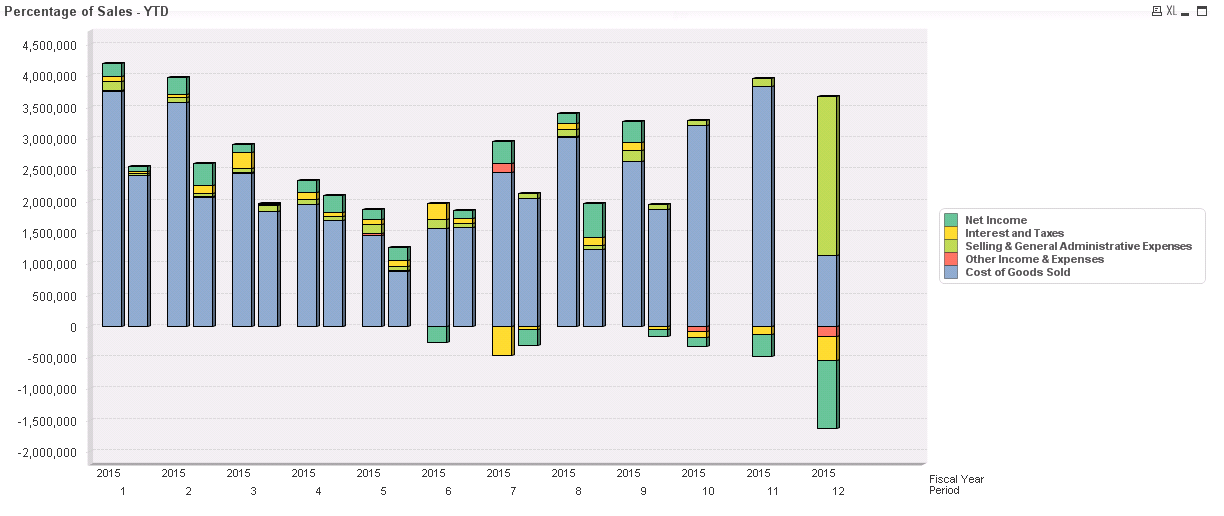
Can you give a printscreen of your graph? thanks
- Mark as New
- Bookmark
- Subscribe
- Mute
- Subscribe to RSS Feed
- Permalink
- Report Inappropriate Content
Hi Steven,
in chart properties, in the Style tab, you have the option for subtype in which you can choose between stacked or grouped bar charts.
Please let me know if this is what you where looking for.
Kind regards,
- Mark as New
- Bookmark
- Subscribe
- Mute
- Subscribe to RSS Feed
- Permalink
- Report Inappropriate Content
Hey Santiago,
I've already discovered and toyed with that option. I've found that when using one dimension the style option works as I would anticipate; however, when throwing more dimensions at the chart, it automatically stacks the bar. So, sorry, this does not resolve my issue.
Thank you,
- Mark as New
- Bookmark
- Subscribe
- Mute
- Subscribe to RSS Feed
- Permalink
- Report Inappropriate Content
- Mark as New
- Bookmark
- Subscribe
- Mute
- Subscribe to RSS Feed
- Permalink
- Report Inappropriate Content
Do you use those two dimensions because you want to see YearMonth like Jan 2016, Feb 2016 etc.
create a YearMonth in your script and use that as a single dimension.
- Mark as New
- Bookmark
- Subscribe
- Mute
- Subscribe to RSS Feed
- Permalink
- Report Inappropriate Content
Sounds like good option.