Unlock a world of possibilities! Login now and discover the exclusive benefits awaiting you.
- Qlik Community
- :
- All Forums
- :
- QlikView App Dev
- :
- Scatter Plot with Dates
- Subscribe to RSS Feed
- Mark Topic as New
- Mark Topic as Read
- Float this Topic for Current User
- Bookmark
- Subscribe
- Mute
- Printer Friendly Page
- Mark as New
- Bookmark
- Subscribe
- Mute
- Subscribe to RSS Feed
- Permalink
- Report Inappropriate Content
Scatter Plot with Dates
I am starting to suspect that I cannot use dates in the X (or y) axis on a scatter plot. It looks like Qlikview is expecting it to be an integer.
Is this true and if not how is this possible?
I am currently working around the issue by tagging my data points with a numeric representation of the date value and then using that in the axis.
When I attempt to use the actual date it is not reacting as I would like.
- Mark as New
- Bookmark
- Subscribe
- Mute
- Subscribe to RSS Feed
- Permalink
- Report Inappropriate Content
I think it should work, if your dates are interpreted as such, i.e. they show a numeric representation (dual values).
What do you see if you are using dates (what is the issue you see)?
- Mark as New
- Bookmark
- Subscribe
- Mute
- Subscribe to RSS Feed
- Permalink
- Report Inappropriate Content
That's what I thought it should do . However when I attempt to use the dates directly the x axis goes to various years and drops my data points into one spot.
My data points are for several hours across a few day span but for some reason the axis defaults to years.
Thinking there may be something I can change in the properties to get this to work right but not sure what it is.
- Mark as New
- Bookmark
- Subscribe
- Mute
- Subscribe to RSS Feed
- Permalink
- Report Inappropriate Content
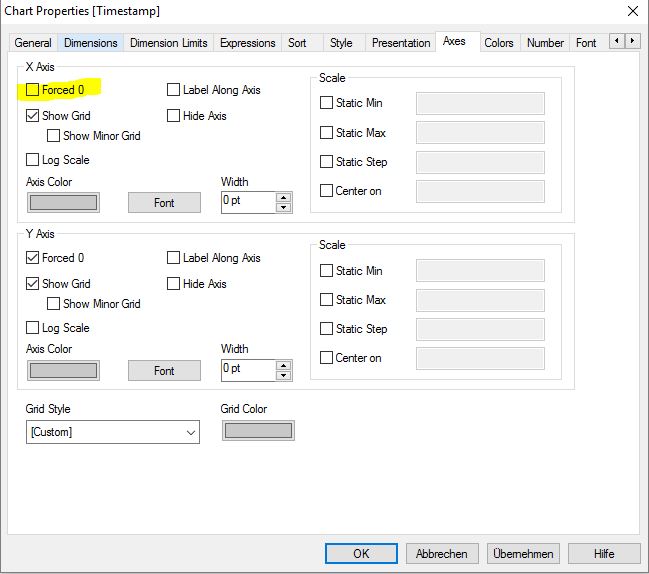
I remember I ran into this issues as well some time ago. I think I've handled this by setting the static min / max on axes tab (you can use expressions for static min / max to keep it dynamic to your data range).
- Mark as New
- Bookmark
- Subscribe
- Mute
- Subscribe to RSS Feed
- Permalink
- Report Inappropriate Content
Hi,
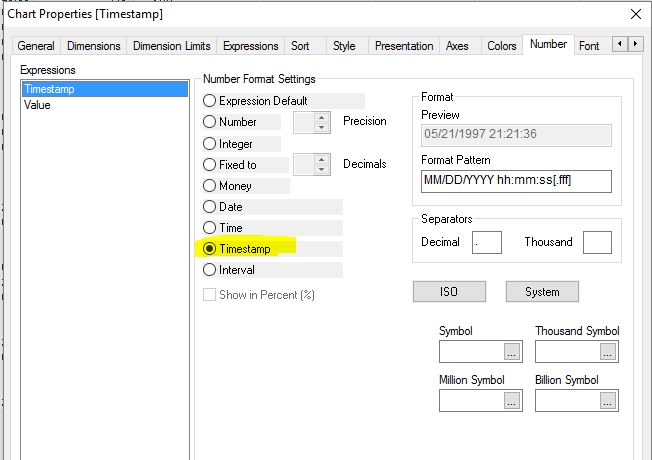
to change the default behaviour from
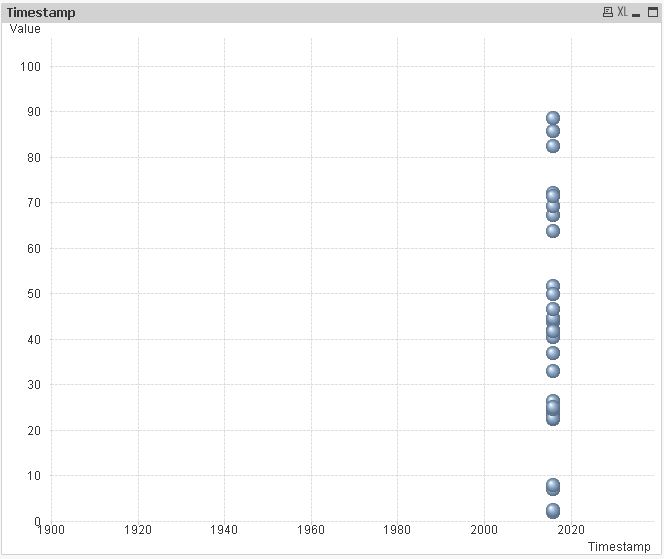
to
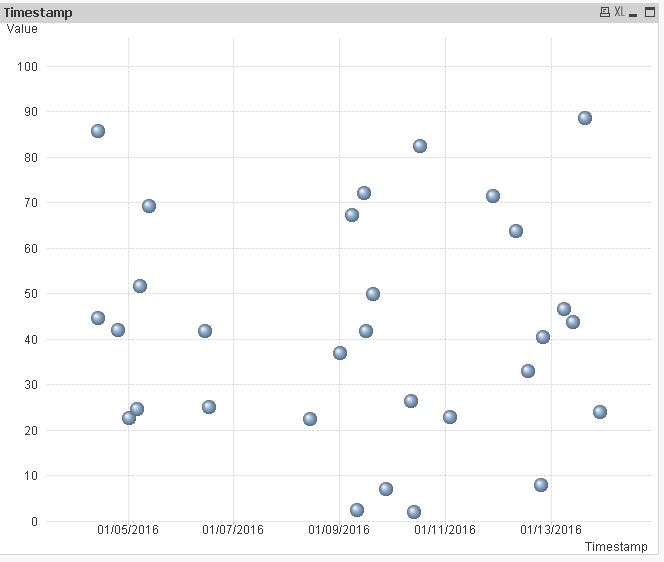
you can also deselect the "forced 0" option of the x-Axis and set the number format to timestamp:
hope this helps
regards
Marco