Unlock a world of possibilities! Login now and discover the exclusive benefits awaiting you.
- Qlik Community
- :
- All Forums
- :
- QlikView App Dev
- :
- Thousand vs Million Symbol on Chart Y-Axis
- Subscribe to RSS Feed
- Mark Topic as New
- Mark Topic as Read
- Float this Topic for Current User
- Bookmark
- Subscribe
- Mute
- Printer Friendly Page
- Mark as New
- Bookmark
- Subscribe
- Mute
- Subscribe to RSS Feed
- Permalink
- Report Inappropriate Content
Thousand vs Million Symbol on Chart Y-Axis
Is there a way to define when the thousand vs million symbol gets used in a chart? I have a line chart showing the past 12 months of premiums. I'm using the thousand and millions symbol so that the y-axis label will auto-adjust (K vs M) based on the premium volume. It works perfectly when premiums are all in millions or all in thousands. However, I'm noticing that if one of my monthly datapoints goes below $1 million (even just slightly below the $1 Million mark), the symbol displayed on the axis is in thousands instead of millions. Can I define when the thousand vs million symbol actually gets used? Ideally, if any of my prior 12 months are in millions, the millions symbol should be used. Thanks in advance!!
- Tags:
- new_to_qlikview
Accepted Solutions
- Mark as New
- Bookmark
- Subscribe
- Mute
- Subscribe to RSS Feed
- Permalink
- Report Inappropriate Content
If you set the Axes, Static Step value to 1M (or some multiple), you will force the M scaling to be used.
You can conditionally set the Static Step value to be 1M only when at least one Month exceeds 1M in value like this:
=if(max(aggr(sum(Value),Month))>1000000, 1000000)
See attached example.
-Rob
- Mark as New
- Bookmark
- Subscribe
- Mute
- Subscribe to RSS Feed
- Permalink
- Report Inappropriate Content
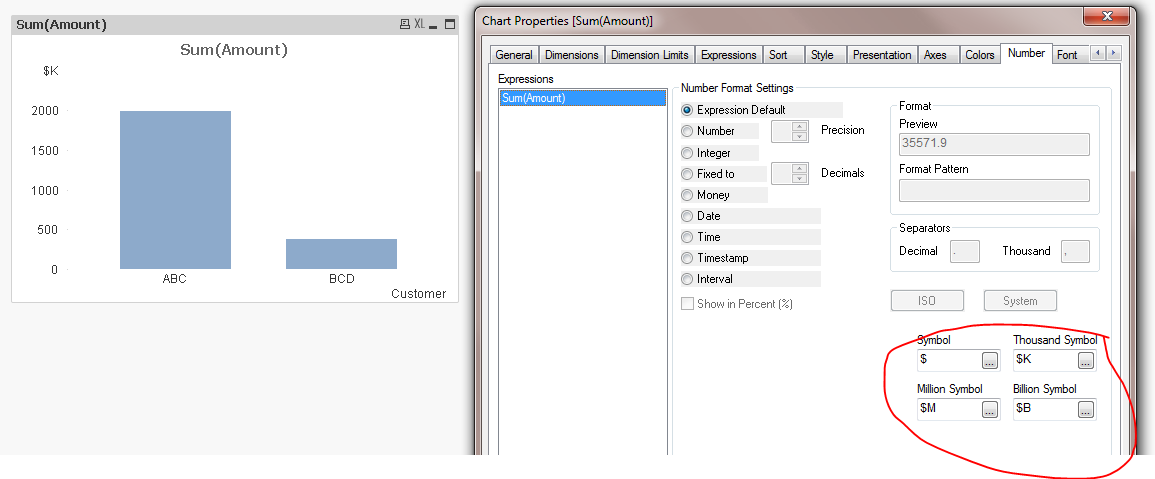
In the chart properties, go to Number tab:
- Mark as New
- Bookmark
- Subscribe
- Mute
- Subscribe to RSS Feed
- Permalink
- Report Inappropriate Content
If you set the Axes, Static Step value to 1M (or some multiple), you will force the M scaling to be used.
You can conditionally set the Static Step value to be 1M only when at least one Month exceeds 1M in value like this:
=if(max(aggr(sum(Value),Month))>1000000, 1000000)
See attached example.
-Rob
- Mark as New
- Bookmark
- Subscribe
- Mute
- Subscribe to RSS Feed
- Permalink
- Report Inappropriate Content
Rob - Thanks for the explanation! I only have QlikView PE at work right now, so I can't open the qvw file, but I was able to modify the code for my needs. It was driving me crazy when I had a graph with 11 months of data over $1M and one month at $972K and the scale was in thousands instead of millions. Appreciate the help to force when the M scale should be used.
Thx, Scott