Unlock a world of possibilities! Login now and discover the exclusive benefits awaiting you.
- Qlik Community
- :
- All Forums
- :
- QlikView App Dev
- :
- Set Analysis Help
- Subscribe to RSS Feed
- Mark Topic as New
- Mark Topic as Read
- Float this Topic for Current User
- Bookmark
- Subscribe
- Mute
- Printer Friendly Page
- Mark as New
- Bookmark
- Subscribe
- Mute
- Subscribe to RSS Feed
- Permalink
- Report Inappropriate Content
Set Analysis Help
Hey,
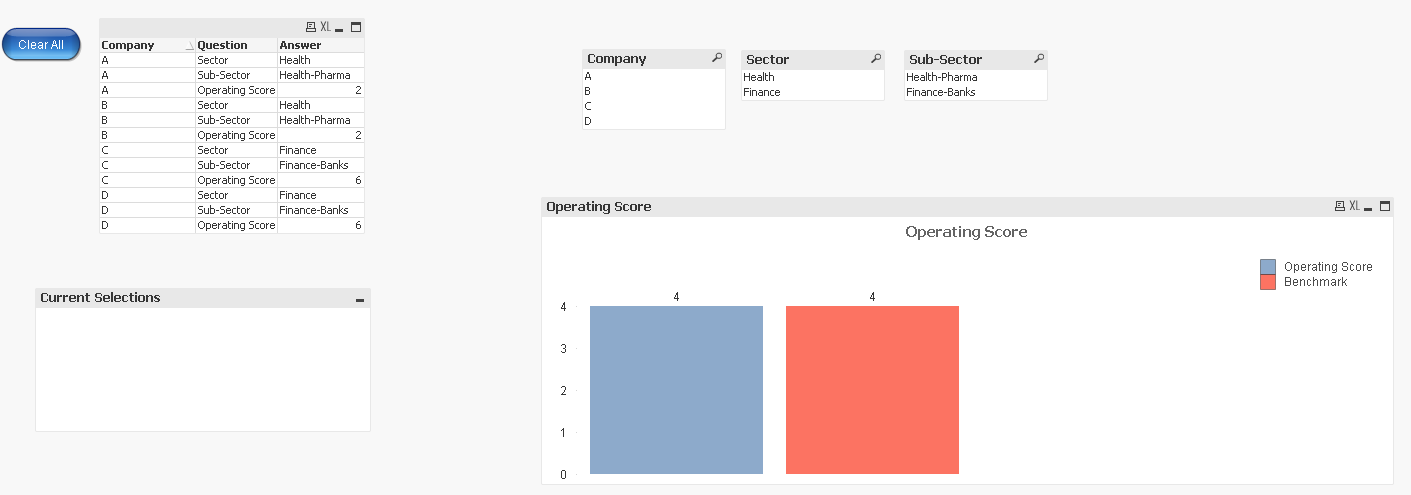
I am having difficulty creating a couple statements to help work with my current data set. First objective is to have the blue bar be the sum operating score between the company, sector, and sub-sector. The second is to have the red bar be the avg operating score between the company, sector, and sub-sector selected.
Restrictions -
1. Company must be selected first.
2. Then we need to benchmark it against overall average and then give a user the option to drill down by the sector and sub-sector.
Please let me know if you need more detail! I really need some help with this!
Example,
If I select Sector Health and Sub-sector Health - Phama, my red bar should reflect the avg between the two selections (2) and my blue bar should reflect the total sum of the selections (4)
- Tags:
- new_to_qlikview
- Mark as New
- Bookmark
- Subscribe
- Mute
- Subscribe to RSS Feed
- Permalink
- Report Inappropriate Content
Please post the sample app or data