Unlock a world of possibilities! Login now and discover the exclusive benefits awaiting you.
- Qlik Community
- :
- All Forums
- :
- QlikView App Dev
- :
- What is No Accumulation and full accumulation with...
- Subscribe to RSS Feed
- Mark Topic as New
- Mark Topic as Read
- Float this Topic for Current User
- Bookmark
- Subscribe
- Mute
- Printer Friendly Page
- Mark as New
- Bookmark
- Subscribe
- Mute
- Subscribe to RSS Feed
- Permalink
- Report Inappropriate Content
What is No Accumulation and full accumulation with examples
What is No Accumulation and full accumulation with examples
- Tags:
- new_to_qlikview
- Mark as New
- Bookmark
- Subscribe
- Mute
- Subscribe to RSS Feed
- Permalink
- Report Inappropriate Content
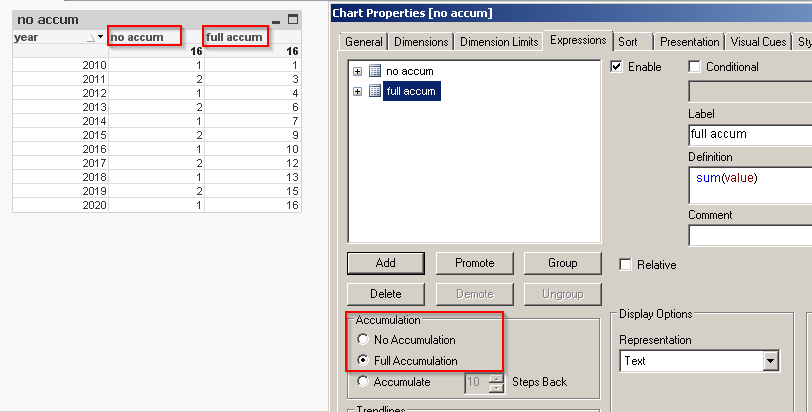
from QlikView help, Accumulation:
By choosing between the settings in this group, you decide whether the values in the chart should be accumulated or not. In an accumulated chart, each y-value is added to the y-value of the following x-value. In an accumulated bar chart showing the sum of sales per year, e.g. the value of the year 1996 is added to that of the year 1997. If your chart contains several expressions, select the expression which values to be accumulated in the Expressions list. Accumulation is not available for pivot tables.
- Mark as New
- Bookmark
- Subscribe
- Mute
- Subscribe to RSS Feed
- Permalink
- Report Inappropriate Content
Hi Raja,
Accumulation in Qlikview
Accumulation in Qlikview means weather you want the value should be accumulate or not in the chart if so it means the value of the X-row is added to the Y-row value in the chart and keep adding till the end of the row that is available in the chart. It depends on the chart values like which dimension is used to display the accumulation value among the chart.
Let me explain with some data and small example, for better explanation about the accumulation in the chart. And as i say it depends on the dimension and which expression you choose for the accumulation because in the data model there is so much different types of the dimension and expression are available. Accumulation works very well in the Straight chart and Bar charts it will not, it will not work very well in the Pivot charts.
I have small data for this explanation and that is
Sample Inline Load Script:-

Above is the simple table structure where you get the Date column and the [Sale Value] column for the particular dates it is simple and very easy sales transaction part with few rows. Which carry the transaction values and the data for the dates let see how it looks after the loading.
Table Structure:- For accumulation we have to make a straight chart for this we take the straight table with Dimension Date.
1. Dimension used -> Date
2. Expression used -> Sum(Value)
3. Expression used for accumulation value -> Rangesum(Above([Accumulate Value], ), Sum(Value))
Here with the help of the RangeSum we are able to sum the value for its consecutive rows with the combination of the Above functions also. Later on the Blog i explain in more details about the RangeSum what is and how powerful it is. After all this we get data in the straight chart.

- Mark as New
- Bookmark
- Subscribe
- Mute
- Subscribe to RSS Feed
- Permalink
- Report Inappropriate Content
Hi Massimo Grossi,
Thanks a lot.It is very helpful to me.
Thanks & Regards
Raja
- Mark as New
- Bookmark
- Subscribe
- Mute
- Subscribe to RSS Feed
- Permalink
- Report Inappropriate Content
please mark helpful and correct answer and close the discussion; thanks