Unlock a world of possibilities! Login now and discover the exclusive benefits awaiting you.
- Qlik Community
- :
- All Forums
- :
- QlikView App Dev
- :
- How to modify amounts at script level?
- Subscribe to RSS Feed
- Mark Topic as New
- Mark Topic as Read
- Float this Topic for Current User
- Bookmark
- Subscribe
- Mute
- Printer Friendly Page
- Mark as New
- Bookmark
- Subscribe
- Mute
- Subscribe to RSS Feed
- Permalink
- Report Inappropriate Content
How to modify amounts at script level?
hi all,
I have a set of accounting data from the beginning of this year. I need to show a P&L accounts balances (let's call the dimension with figures a "Amount") either from 01.01.2015 or from 01.02.2015 - B/S should be always shown from 01.01.2015. the simplest idea is to inline load a new dimension with "from Jan" "from Feb" records, and then in chart or table make "if()" formula so that balances are correctly shown subject to choosing one of the new dimension records. This would work but I would need to add this if() formula to each table or chart I use, and some of the formulas are already quite complex there. I was wondering if there is a way to create the dimension sensitive to the "from jan" "from feb" choice already when loading data, so that all other operations are made already on "Amount" that shows appropriate balances depending upon the choice of either "from Jan" or "from Feb"?
thanks for any help
- Tags:
- new_to_qlikview
- Mark as New
- Bookmark
- Subscribe
- Mute
- Subscribe to RSS Feed
- Permalink
- Report Inappropriate Content
please post sample data and expected result.
regards
Marco
- Mark as New
- Bookmark
- Subscribe
- Mute
- Subscribe to RSS Feed
- Permalink
- Report Inappropriate Content
Hi,
I have not been here for some time, and I see I am not able to publish a QV report here. So, I attach the pictures showing my problem.
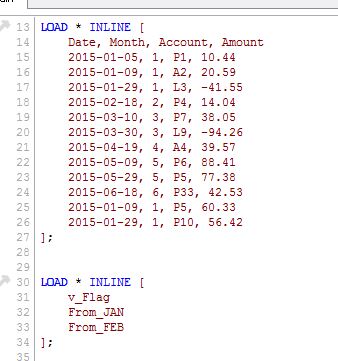
I load the data and additional dimension x_Flag (script.jpg)
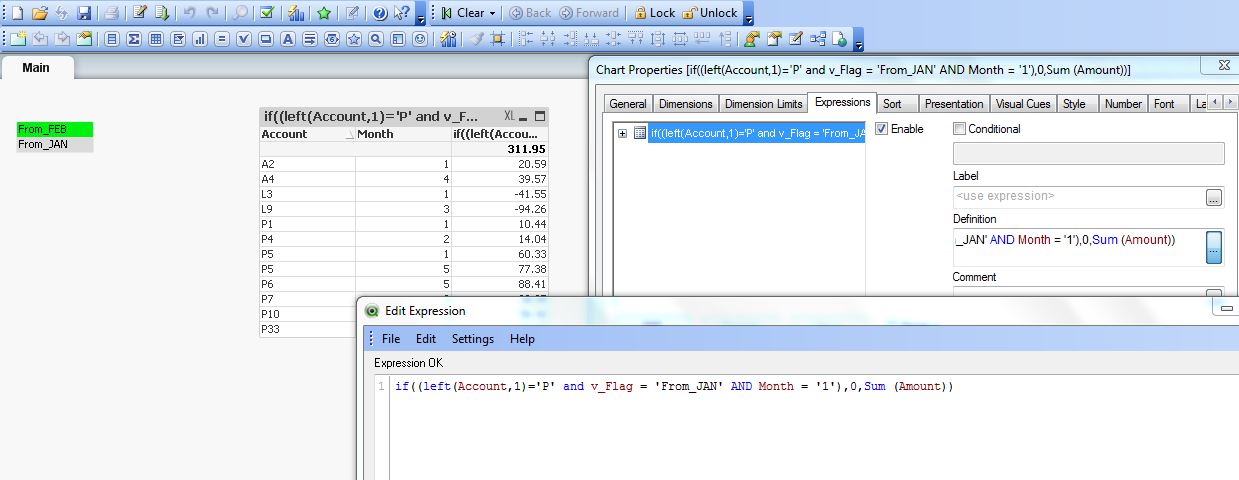
To get rid of the Jan amounts in P&L then choosing From_Feb, I wrote the following formula sown in report.jpg
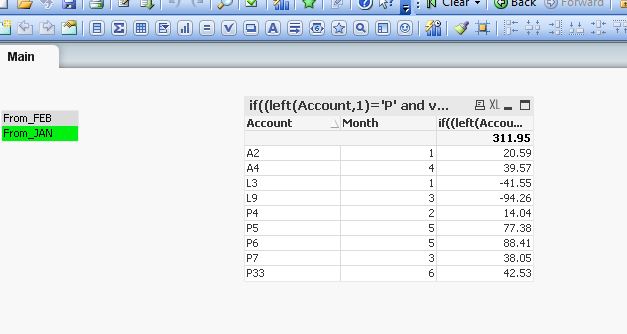
Now, when choosing From_Feb, P1 and P10 rows (comtaining P&L accounts with Jan bookings) dissapear from my list.
Drawback of this solution is that:
- I have many tables in my report and do not want to repeat this formula in each of them, especially that in some, the formulas are already quite complex
- As you see, even though P1 and P10 dissapear from the list, the sum does not change.
Desired scenario: To modify the Amount in desired way, not in each table or chart built in the report, but on some earlier stage so that a new modified dimension is available for all tables/charts created.
thanks a lot for any comments
- Mark as New
- Bookmark
- Subscribe
- Mute
- Subscribe to RSS Feed
- Permalink
- Report Inappropriate Content
Draszor,
if you open the 'advanced editor' here in the forum (e.g. action->edit your last post, upper right corner --> Use advanced editor), you can upload files, which makes it easier to play with your data. Or post an INLINE table as text, not as jpeg, so one is able to copy and paste your data.
Coming to your request:
a) I think your expression should show all values when clicking on From_JAN, and hide data when clicking on From_Feb, currently it's the other way round, right?
b) The total amount should be correct, if you use the condition inside the sum():
=sum( if(....., Amount))
c) it would be better to link your data to a flag in your data model:
LOAD *,
if(Left(Account,1) = 'P' and Month = 1, 1,0) as Flag;
LOAD Date, Month, Account, Amount
FROM ....;
[AmountSelector]:
LOAD 0 as Flag,
'From Feb' as [Amount Selector]
autogenerate 1;
LOAD 0 as Flag,
'From Jan' as [Amount Selector]
autogenerate 1;
LOAD 1 as Flag,
'From Jan' as [Amount Selector]
autogenerate 1;
Now you should be able to just use sum(Amount) as expression and filter using the field [Amount Selector] (e.g. using a list box).