Unlock a world of possibilities! Login now and discover the exclusive benefits awaiting you.
- Qlik Community
- :
- All Forums
- :
- QlikView App Dev
- :
- Gauge / Speedometer Chart (Color condition)
- Subscribe to RSS Feed
- Mark Topic as New
- Mark Topic as Read
- Float this Topic for Current User
- Bookmark
- Subscribe
- Mute
- Printer Friendly Page
- Mark as New
- Bookmark
- Subscribe
- Mute
- Subscribe to RSS Feed
- Permalink
- Report Inappropriate Content
Gauge / Speedometer Chart (Color condition)
Hello,
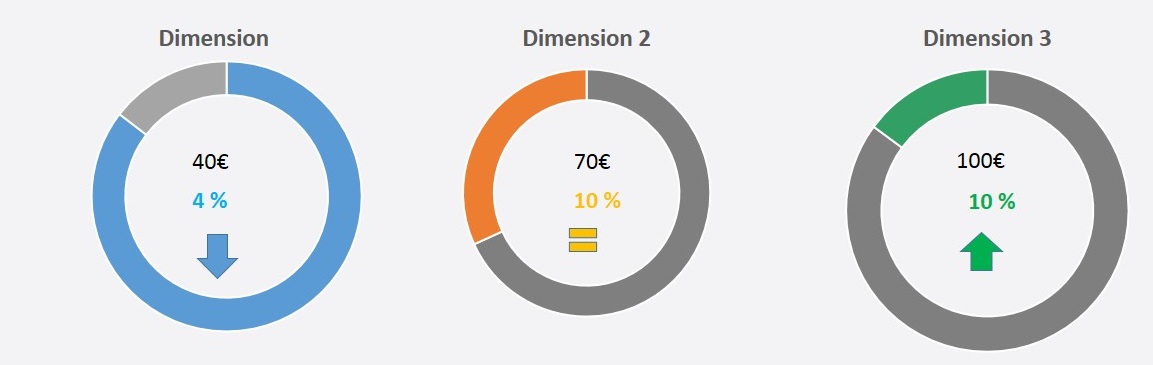
I have to create 3 Gauge / Speedometer Charts with the following coloring requirements for the 3 of them:
1 - The bar should be turn Blue when the variation Value is negative.
2- The bar should be turn Orange when the variation Value is not too hight or too low .
3- The bar should be turn Green when the variation Value is hight.
Can you please help acomplish those, here a picture from the requirement:
Previously, in the color section i wrote the following expression, but it didnt work:
(
(
(
sum(Value)
/
sum({<$(vMonthPreviousYear)>}Value)
)-1
)<0
, rgb(0,255,255), rgb(0,0,0))
Thanks for your help.
Accepted Solutions
- Mark as New
- Bookmark
- Subscribe
- Mute
- Subscribe to RSS Feed
- Permalink
- Report Inappropriate Content
Hi Iuri,
please look at attached app and let me know if it is ok for your needs.
try it assigning values (both negative and positive) to v_expval using the input box.
Best regards
Andrea
- Mark as New
- Bookmark
- Subscribe
- Mute
- Subscribe to RSS Feed
- Permalink
- Report Inappropriate Content
here you have an example
- Mark as New
- Bookmark
- Subscribe
- Mute
- Subscribe to RSS Feed
- Permalink
- Report Inappropriate Content
Hi Iuri,
please look at attached app and let me know if it is ok for your needs.
try it assigning values (both negative and positive) to v_expval using the input box.
Best regards
Andrea
- Mark as New
- Bookmark
- Subscribe
- Mute
- Subscribe to RSS Feed
- Permalink
- Report Inappropriate Content
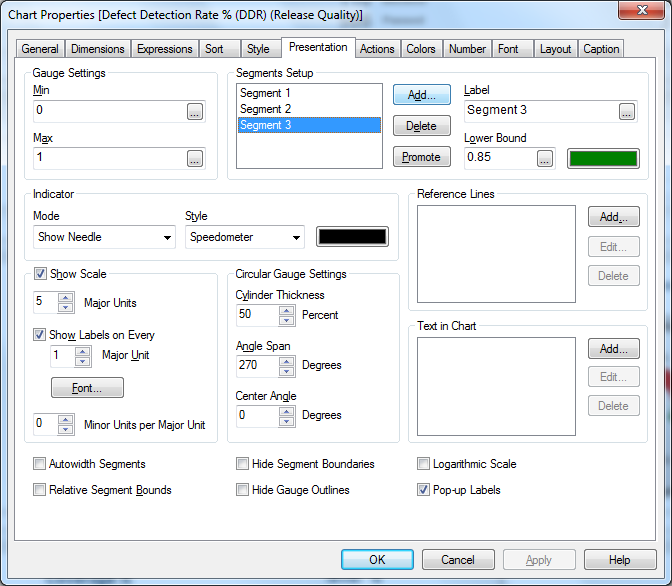
you dont need to write expression under color tab.
you need to define the segments.
if you want only two colors just define one segment
see image.
Thanks
BKC
- Mark as New
- Bookmark
- Subscribe
- Mute
- Subscribe to RSS Feed
- Permalink
- Report Inappropriate Content
Thank you anlonghi2,
That approach is closer to my needs.