Unlock a world of possibilities! Login now and discover the exclusive benefits awaiting you.
- Qlik Community
- :
- All Forums
- :
- QlikView App Dev
- :
- Container or Grouping for Multiple Selection Tabs
- Subscribe to RSS Feed
- Mark Topic as New
- Mark Topic as Read
- Float this Topic for Current User
- Bookmark
- Subscribe
- Mute
- Printer Friendly Page
- Mark as New
- Bookmark
- Subscribe
- Mute
- Subscribe to RSS Feed
- Permalink
- Report Inappropriate Content
Container or Grouping for Multiple Selection Tabs
Hello,
I am new to Qlikview and I have been going through some tutorials so far. I am trying to figure out:
How to create a table in QlikView that the user can select which dimensions are included in the table.
For example:
- If we have a list like:
- Customer Number
- Month
- Year
- I want to be able to select which dimensions to include in the table
- Maybe just Customer Number
- Maybe Customer Number and Month
- Maybe all three or any combination
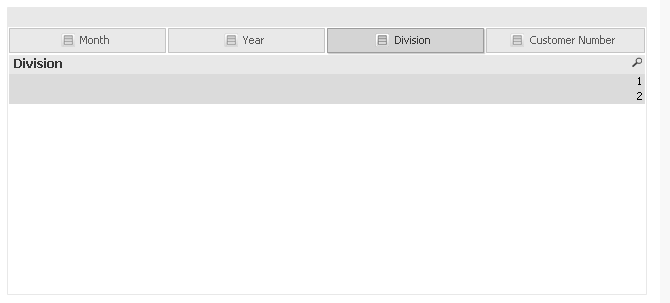
So far I could only find grouping and container as closest solution but it only allows to show one at a time (container's grid option doesn't give option to de-select tables that I dont want -it just includes all tables )
Below in the single object example for container - i can only select at one time. If i want to see year and month at the same time (but i dont want to see division and customer number) there is no way
I also tried grouping (cycle) and it also just gives me to select only 1 tab at a time.
Is there any way ?
Thanks
Arman
- Mark as New
- Bookmark
- Subscribe
- Mute
- Subscribe to RSS Feed
- Permalink
- Report Inappropriate Content
i think u have to go with adhoc reports,PFA.
- Mark as New
- Bookmark
- Subscribe
- Mute
- Subscribe to RSS Feed
- Permalink
- Report Inappropriate Content
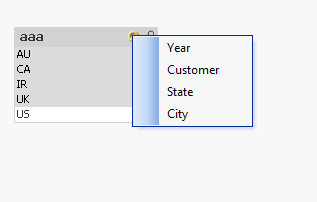
there is no need of container, if you want to choose dimensions and metrics:
- Mark as New
- Bookmark
- Subscribe
- Mute
- Subscribe to RSS Feed
- Permalink
- Report Inappropriate Content
The adhoc report is probably the nicest solution from a development perspective as you can change the measures that are presented.
However, if you want to keep it simple you also have the option of a pivot table with multiple cycle groups as dimensions. If all of your possible dimension fields are included in each of the (for example) 3 cycle groups then you can pick and choose how many are presented by collapsing the 3rd and 2nd group as required. This is a reasonably quick and easy way for users to have a chart (with fixed measure fields) that they can adapt easily.
Very basic example attached for you to see how it's set up... super simple to build and to use.