Unlock a world of possibilities! Login now and discover the exclusive benefits awaiting you.
- Qlik Community
- :
- All Forums
- :
- QlikView App Dev
- :
- Issue with table having Aggr Expression
- Subscribe to RSS Feed
- Mark Topic as New
- Mark Topic as Read
- Float this Topic for Current User
- Bookmark
- Subscribe
- Mute
- Printer Friendly Page
- Mark as New
- Bookmark
- Subscribe
- Mute
- Subscribe to RSS Feed
- Permalink
- Report Inappropriate Content
Issue with table having Aggr Expression
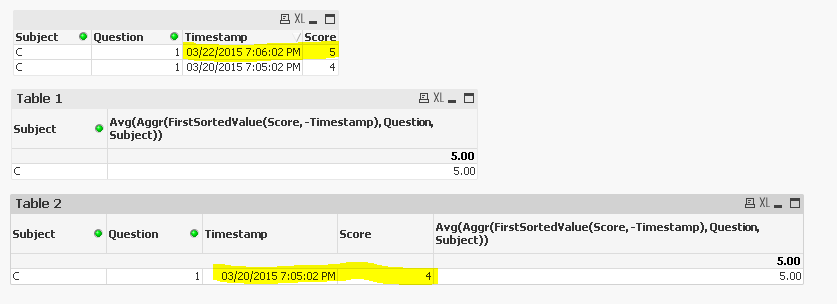
Hi all, In the attached qlikview file, there are two tables.
Table 1 calculates the average score taking the RECENT response. This calculation works as expected.
In table 2, I want to show the recent response that was considered. I also need to show the final average. This is not working as expected. If we filter subject C, Question 1 , we can see table 1 displays first value instead of recent value. Any help on fixing this would be appreciated. Thank you!
- Tags:
- new_to_qlikview
Accepted Solutions
- Mark as New
- Bookmark
- Subscribe
- Mute
- Subscribe to RSS Feed
- Permalink
- Report Inappropriate Content
Use calculated dimensions for Timestamp and Score as well:
For Timestamp: =Aggr(FirstSortedValue(Timestamp, -Timestamp), Question, Subject)
For Score: =Aggr(FirstSortedValue(Score, -Timestamp), Question, Subject)
Also find attached your application.
HTH
Best,
Sunny
- Mark as New
- Bookmark
- Subscribe
- Mute
- Subscribe to RSS Feed
- Permalink
- Report Inappropriate Content
With your selection Table2 has two data points. Disable Zero-Value suppression, and you will see that Table2 has the same dimensions as your table box.
1. Chart Object > Properties > Presentation
2. Uncheck Suppress Zero-Values
Also keep in mind that Aggr() returns distinct data by default. Add NODISTINCT in your expression to get the result to expand on all rows of the table.
Avg(Aggr(NODISTINCT FirstSortedValue(Score, -Timestamp), Question, Subject))
- Mark as New
- Bookmark
- Subscribe
- Mute
- Subscribe to RSS Feed
- Permalink
- Report Inappropriate Content
Use calculated dimensions for Timestamp and Score as well:
For Timestamp: =Aggr(FirstSortedValue(Timestamp, -Timestamp), Question, Subject)
For Score: =Aggr(FirstSortedValue(Score, -Timestamp), Question, Subject)
Also find attached your application.
HTH
Best,
Sunny
- Mark as New
- Bookmark
- Subscribe
- Mute
- Subscribe to RSS Feed
- Permalink
- Report Inappropriate Content
Generally calculated dimensions should be avoided, as they add a virtual dimension to the calculation. This is very likely to have a negative impact on the chart performance and also can lead to unexpected calculation results.
The Aggr() based example looks a bit over complicated.Working with flags in your data model for example allows for making simple set expressions in your charts. By using a set expression you limit the dimensional values, compared to creating virtual dimensions through Aggr().
As an example in the attached QVW I have created a flag during load where the most recent records are flagged with 1. With this flag you no longer have to used Aggr() in your chart, instead a simple set expression will limit your aggregation to the data with the flag.
Only({<IsMostRecentScore={"1"}>} Score)
In my opinion this is easier to interpret and understand fro a user or developer, as the expression says that the result is based on data related to the most recent score. It also means that the aggregation is done on a data set based on the set modifier, which commonly means that less data is processed. Simplicity and efficiency.
See Table3 in the attachment as reference.
- Mark as New
- Bookmark
- Subscribe
- Mute
- Subscribe to RSS Feed
- Permalink
- Report Inappropriate Content
I def. agree with you and I would want to avoid using aggregate function in any of my charts, but in his case I am not sure if there is a reason he would want to do this on a front end. If this not a requirement then I would definitely do it the way you have recommended.
Best,
Sunny
- Mark as New
- Bookmark
- Subscribe
- Mute
- Subscribe to RSS Feed
- Permalink
- Report Inappropriate Content
I agree with the both of you. There is a requirement to do this on the front end and not to disturb the data model. Hence the use of Aggr function. Thank you for your input once again.
- Mark as New
- Bookmark
- Subscribe
- Mute
- Subscribe to RSS Feed
- Permalink
- Report Inappropriate Content
The design choice is of course yours to make.
Please notice that if you apply the Aggr() approach in multiple chart in your application you will consume more memory and CPU compared to having a optimized data model. Using Aggr() in a straight table dimension is definitely not a recommended approach, and I think you should be able to move them to expressions instead.
Adding flags to data models does not make any logical change to the data model structure, and will not affect any existing calculation. I think you should make sure to keep that approach open for any future projects, as it will make your work easier and the results better.