Unlock a world of possibilities! Login now and discover the exclusive benefits awaiting you.
- Qlik Community
- :
- All Forums
- :
- QlikView App Dev
- :
- set analysis to exclude negative revenue
- Subscribe to RSS Feed
- Mark Topic as New
- Mark Topic as Read
- Float this Topic for Current User
- Bookmark
- Subscribe
- Mute
- Printer Friendly Page
- Mark as New
- Bookmark
- Subscribe
- Mute
- Subscribe to RSS Feed
- Permalink
- Report Inappropriate Content
set analysis to exclude negative revenue
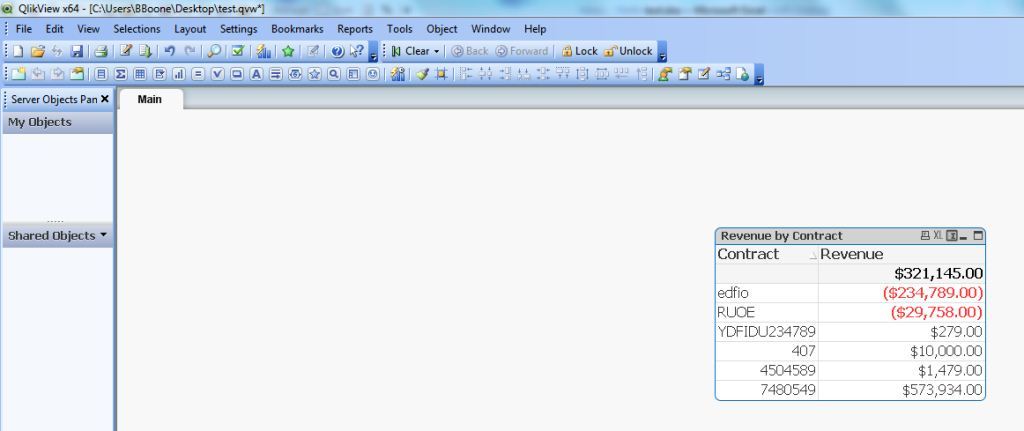
I'm having trouble trying to write a set analysis to include revenue for all contracts, but exclude the specific contracts that have negative revenue. In other words, the expression to sum all revenue would be Sum ([ Revenue USD]) in this example, but I'm not sure how to write the portion where the dimension called Contracts would only include those that have $0 or higher associated revenue. Any ideas?
- « Previous Replies
-
- 1
- 2
- Next Replies »
Accepted Solutions
- Mark as New
- Bookmark
- Subscribe
- Mute
- Subscribe to RSS Feed
- Permalink
- Report Inappropriate Content
You will need to use Aggr():
Sum({<Contacts={"=Aggr(Sum([Revenue USD]),Contacts)>0"}>} [Revenue USD])
- Ralf
- Mark as New
- Bookmark
- Subscribe
- Mute
- Subscribe to RSS Feed
- Permalink
- Report Inappropriate Content
try:
<Contracts={"=Sum ([ Revenue USD])>=0" }>
- Mark as New
- Bookmark
- Subscribe
- Mute
- Subscribe to RSS Feed
- Permalink
- Report Inappropriate Content
Barbara,
let ma know if it works and if you need more help.
regards
Darek
- Mark as New
- Bookmark
- Subscribe
- Mute
- Subscribe to RSS Feed
- Permalink
- Report Inappropriate Content
I'm still trying it out (we have long field names for dimensions so I thought maybe I mistyped something in my QVW). When I look at the table without the set analysis included, it lists each contract and the sum of each contract to the right of each, on the same row.
When I try it with the proposed change listed above, the fields are all coming back blank - I'm not getting any contracts listed and I'm also not getting any revenue.
- Mark as New
- Bookmark
- Subscribe
- Mute
- Subscribe to RSS Feed
- Permalink
- Report Inappropriate Content
maybe you may provide sample application?
- Mark as New
- Bookmark
- Subscribe
- Mute
- Subscribe to RSS Feed
- Permalink
- Report Inappropriate Content
Hopefully this helps; this is just an example since I can't post confidential information here. I'm trying to get a list like this...but only list the contracts that have $0 or greater revenue associated with them. In this case, I would end up with a table that didn't show the first 2 lines, but did show the last 4 contracts here.
- Mark as New
- Bookmark
- Subscribe
- Mute
- Subscribe to RSS Feed
- Permalink
- Report Inappropriate Content
Barbara,
i'am sorry, but your image doesn't provide information i need to write expression for you 
I need chart where this new expression will be used, data model (or its part important for your chart), and some data (but not real data....  .
.
You may load some prepared data for exmaple from excel or use scramble function
Document Properties: Scrambling
This tab is only available when working with a QlikView document in ADMIN mode. It provides the possibility to scramble the data in one or more fields.
| Fields | This is a list of all fields in the document. Select one or more fields for scrambling. |
| Scramble | Press this button to perform a random scrambling of the contents of selected field(s). Numbers are scrambled to numbers and text to text (spaces are kept). Once scrambled, the data cannot be recreated in its original form by QlikTech or anyone else. If the script is re-executed, however, the scrambling will be lost. |
:
- Mark as New
- Bookmark
- Subscribe
- Mute
- Subscribe to RSS Feed
- Permalink
- Report Inappropriate Content
Hi Barbara,
In your script you can take another field as flag and define condition of the flag as per business logic. e.g.
Load
...,
IF(Rev>0,1,0) AS FLAG,
...
Now in set analysis you can write =sum({$<FLAG = {1}>}Rev)
Hope this is what you were looking for. Please let us know if this works.
Thanks & Regards
Suhas Gupta
- Mark as New
- Bookmark
- Subscribe
- Mute
- Subscribe to RSS Feed
- Permalink
- Report Inappropriate Content
Suhas,
i think that Barbara needs it rather on the fly. I can imagine, that there is a question on aggregated revenue (from more than one transaction), after user selections ....
regards
Darek
- Mark as New
- Bookmark
- Subscribe
- Mute
- Subscribe to RSS Feed
- Permalink
- Report Inappropriate Content
You will need to use Aggr():
Sum({<Contacts={"=Aggr(Sum([Revenue USD]),Contacts)>0"}>} [Revenue USD])
- Ralf
- « Previous Replies
-
- 1
- 2
- Next Replies »