Unlock a world of possibilities! Login now and discover the exclusive benefits awaiting you.
- Qlik Community
- :
- All Forums
- :
- QlikView App Dev
- :
- Olympics: Remove unwanted label
- Subscribe to RSS Feed
- Mark Topic as New
- Mark Topic as Read
- Float this Topic for Current User
- Bookmark
- Subscribe
- Mute
- Printer Friendly Page
- Mark as New
- Bookmark
- Subscribe
- Mute
- Subscribe to RSS Feed
- Permalink
- Report Inappropriate Content
Olympics: Remove unwanted label
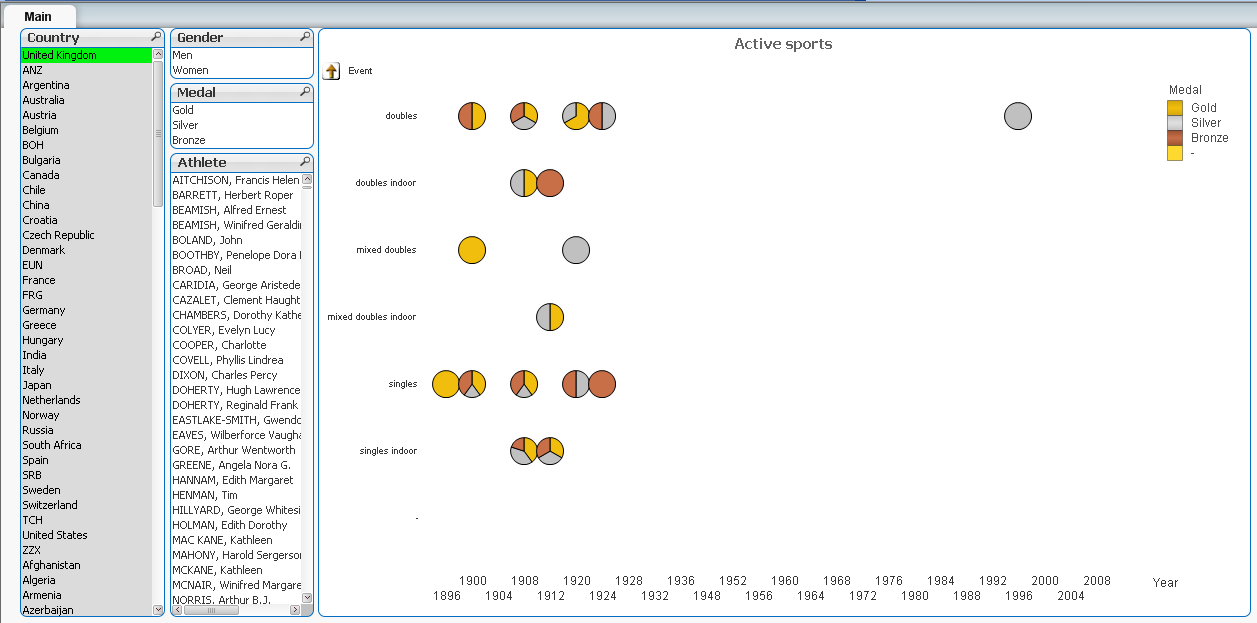
I played around with OS statistics and did the chart below. I struggle. I do want years without data to be displayed, and I don't want null values for medals displayed as the create a new label, the yellow in the bottom. I can remove the yellow label by selecting supress zero values in the presentation tab or supress null on the Medal dimension, but then all my blank years disappear too, only those with values are visible. Can anyone help me to remove the fourth label in the legend while keeping the "empty" years, so that you clearly see the gaps in time? Grateful for a pointer here. QVW is attached.
Second question: Why don't I get gradients in the pies? Only on the legend?
- Mark as New
- Bookmark
- Subscribe
- Mute
- Subscribe to RSS Feed
- Permalink
- Report Inappropriate Content
Hi Christian,
Right click on chart -> Properties -> Dimensions tab
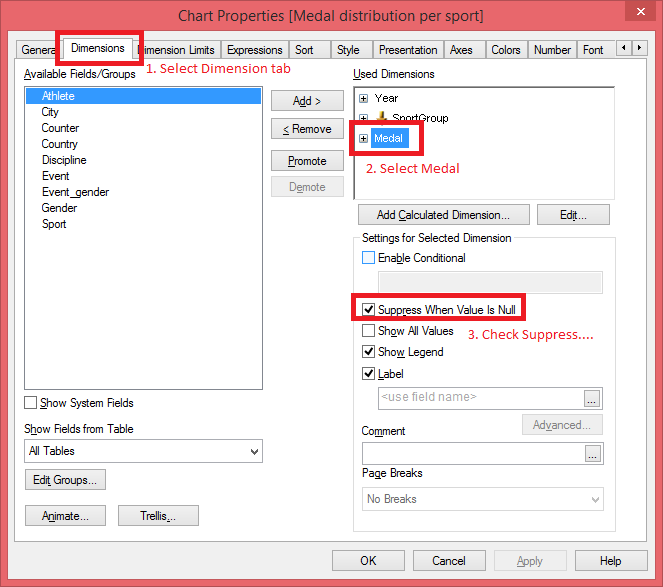
See attached file
Regards,
Sokkorn
- Mark as New
- Bookmark
- Subscribe
- Mute
- Subscribe to RSS Feed
- Permalink
- Report Inappropriate Content
Sokkorn,
Thanks for your answer, but it does unfortuntately not address the problem. As I described, my objective is to keep the years that lack data so that the gaps in time are still visible. Supressing null on the Medal dimension or suppression zero values on the presentation tab both have the effect that all empty years disappear. You get 1924 next to 1984 for some selections.
I wish to keep the empty years, AND I want the yellow forth label gone.
This is tricker than you first assume.
Christian
- Mark as New
- Bookmark
- Subscribe
- Mute
- Subscribe to RSS Feed
- Permalink
- Report Inappropriate Content
Dear Christian,
After checking your script, I think the years are missing from your database for which you want to show the gap.
You need to create years first.
Cntry:
Mapping LOAD
[Int Olympic Committee code],
Country
FROM
(ooxml, embedded labels, table is [IOC COUNTRY CODES]);
DATA:
LOAD City,
Edition as Year,
Sport,
Discipline,
Athlete,
applymap('Cntry',NOC) as Country,
Gender,
Event,
Event_gender,
Medal,
1 as Counter
FROM
(ooxml, embedded labels, header is 4 lines, table is [ALL MEDALISTS]);
MinMaxYear:
Load
NUM(Min(Year)) as MinYear,
NUM(Max(Year)) as MaxYear
Resident DATA;
Let vMinYear = Peek('MinYear',0,'MinMaxYear');
Let vMaxYear = Peek('MaxYear',0,'MinMaxYear');
Drop Table MinMaxYear;
YearField:
LOAD
$(vMinYear) + RowNo() -1 as Year
AUTOGENERATE
$(vMaxYear)- $(vMinYear)+1;
- Mark as New
- Bookmark
- Subscribe
- Mute
- Subscribe to RSS Feed
- Permalink
- Report Inappropriate Content
Thanks Manish,
I appreciate your solution, but unfortunately it generates Years between the summer olympics. All years where there were summer olympics are already present in the data, but not for sub sets of sports or nations. My objective is to display all summer olympics years on the x-axis, but without the fourth label.
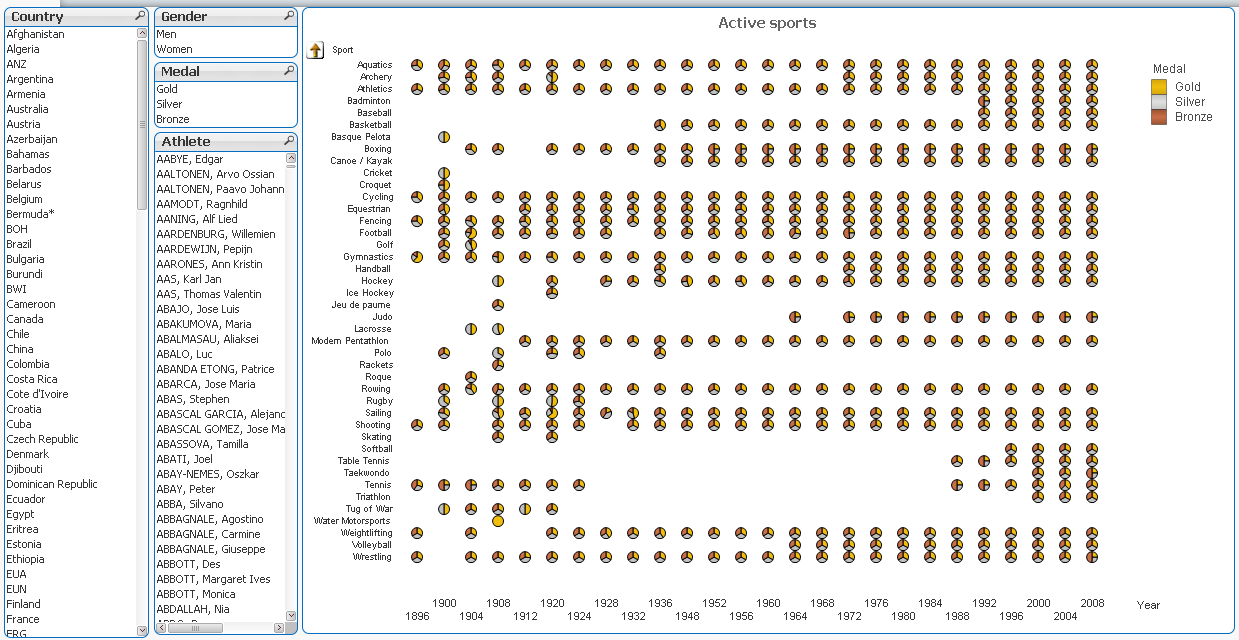
When I show all data, we can see that there are gaps in the years for some sports, as it should be.
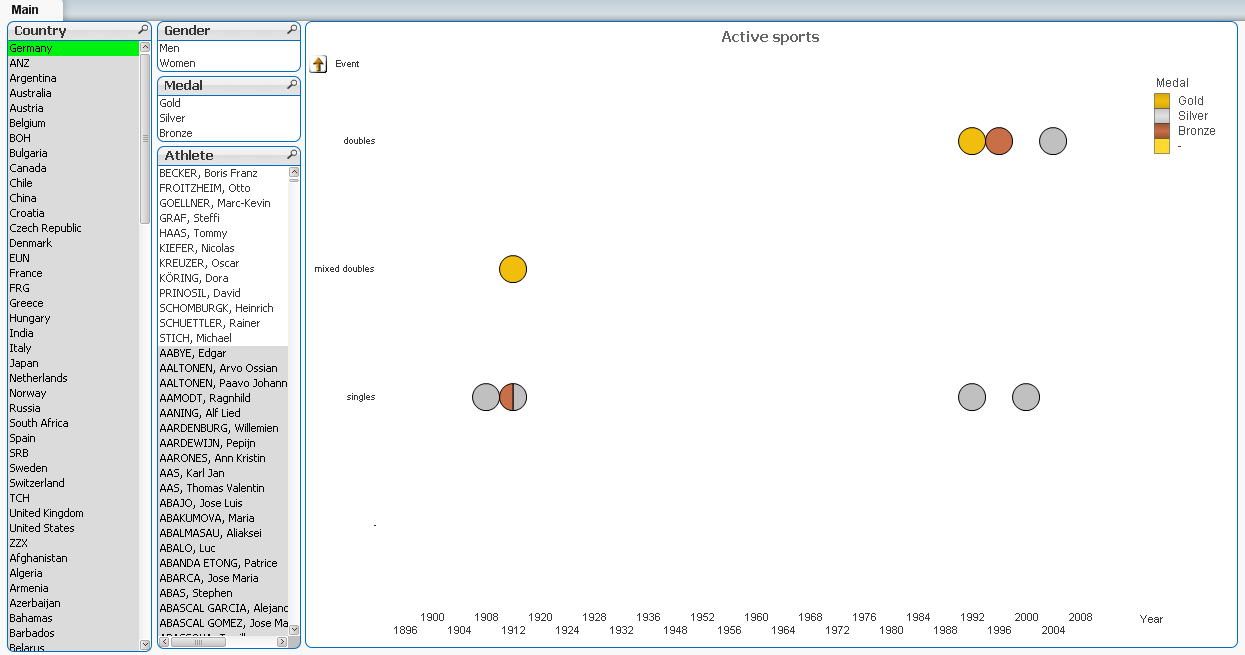
When I select Tennis for germany, or an individual athlet (examples below) I do indeed keep the spaces for empty years, as I wish. But the forth label pops up.
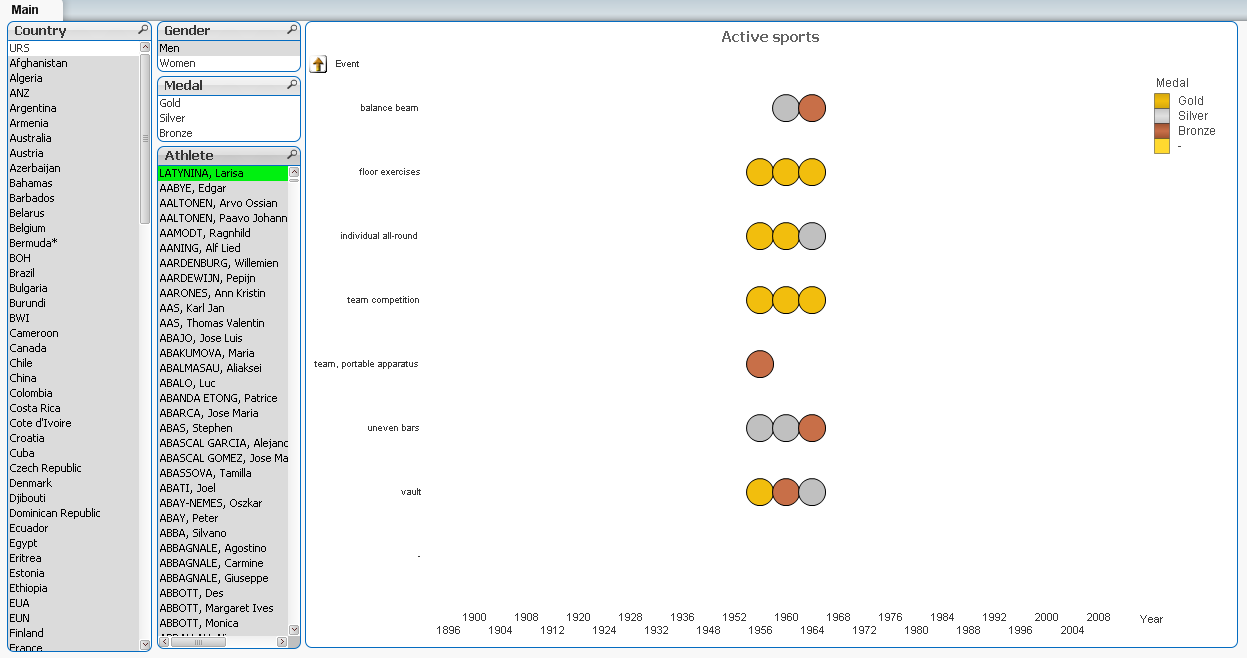
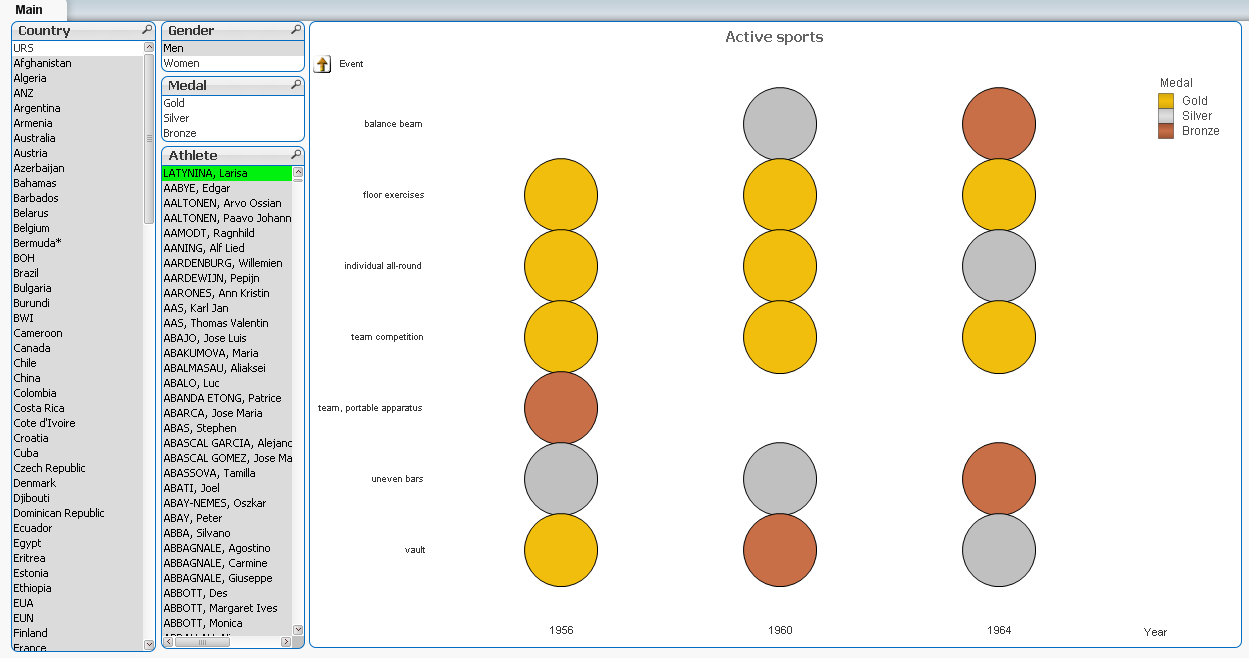
I can eliminate the fourth label by supressing null, but then the time sequence looks continuous, which it is not. You need to read the year values to understand there is a gap (see below). It also looks pretty bad.
So, the challenge remains.... Also, any ideas why the gradients don't show up in the pies? I really appreciate your efforts. /Christian
- Mark as New
- Bookmark
- Subscribe
- Mute
- Subscribe to RSS Feed
- Permalink
- Report Inappropriate Content
Hello christian Lauritzen,
Probably you could keep a text object on the empty legend and make the background color of the text object as white..
Hope this helps
- Mark as New
- Bookmark
- Subscribe
- Mute
- Subscribe to RSS Feed
- Permalink
- Report Inappropriate Content
Hi Christian,
Follow Manish idea's, can you create a table with a distinct years?
Central:
LOAD Distinct Year
RESIDENT Cntry;
-JFlorian