Unlock a world of possibilities! Login now and discover the exclusive benefits awaiting you.
- Qlik Community
- :
- All Forums
- :
- QlikView App Dev
- :
- traffic light in straight table
- Subscribe to RSS Feed
- Mark Topic as New
- Mark Topic as Read
- Float this Topic for Current User
- Bookmark
- Subscribe
- Mute
- Printer Friendly Page
- Mark as New
- Bookmark
- Subscribe
- Mute
- Subscribe to RSS Feed
- Permalink
- Report Inappropriate Content
traffic light in straight table
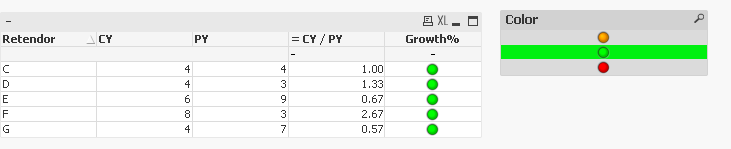
in below table i would want Amber if CY-PY=0 and GREEN if CY-PY>0 and RED if CY-PY<0
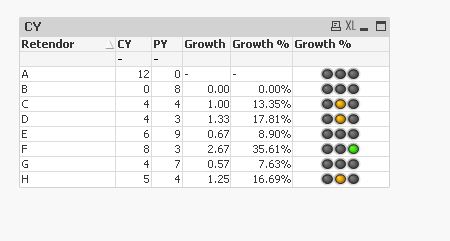
there should be only one light and not three. as in if its green then the other two greys should not be there. single circle.
What should the expression be and what should the gauge settings be? I am not aware of the bounds in gauge settings.
And can we bring the traffic light next to a value and not as a separate column?
Accepted Solutions
- Mark as New
- Bookmark
- Subscribe
- Mute
- Subscribe to RSS Feed
- Permalink
- Report Inappropriate Content
May be helpful read Here: Gauges – QLIKIES
Using inbuilt LED images would be better option to show this traffic light display. use something like this:
Expression for Growth
= IF(CY/PY = 0.00, 'qmem://<bundled>/BuiltIn/led_o.png', IF(CY/PY > 0.00,'qmem://<bundled>/BuiltIn/led_g.png', IF(CY/PY < 0.00, 'qmem://<bundled>/BuiltIn/led_r.png')))
- Mark as New
- Bookmark
- Subscribe
- Mute
- Subscribe to RSS Feed
- Permalink
- Report Inappropriate Content
Are you looking for something like this?
- Mark as New
- Bookmark
- Subscribe
- Mute
- Subscribe to RSS Feed
- Permalink
- Report Inappropriate Content
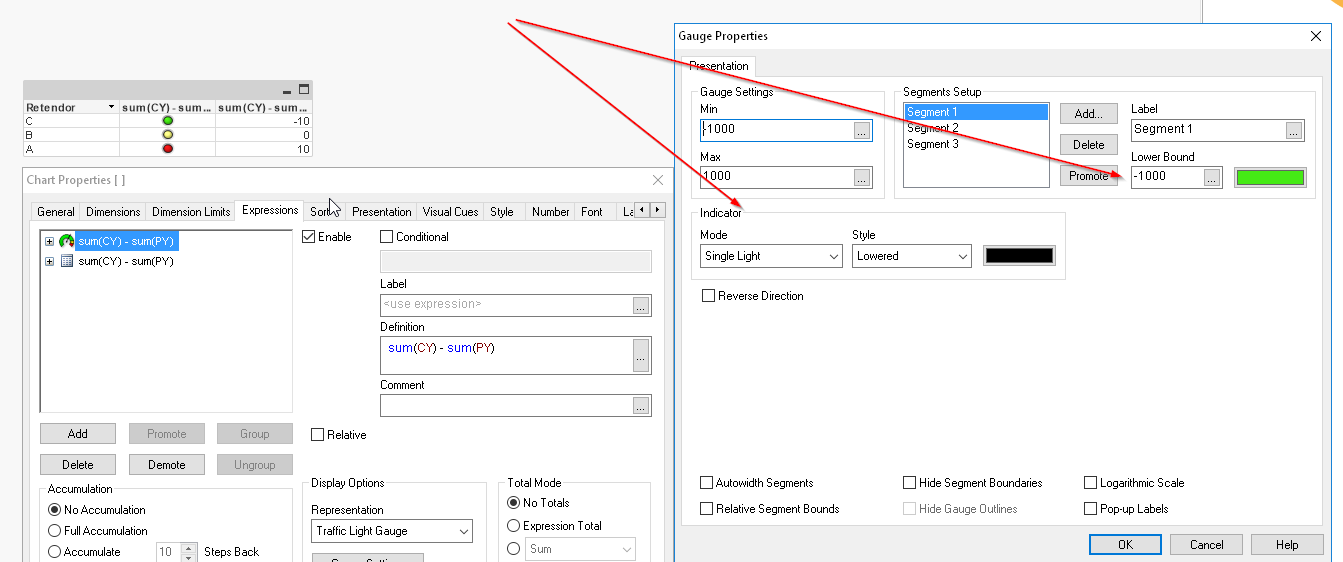
try to check the gauge properties,
Indicator Mode
Segments Setup
- Mark as New
- Bookmark
- Subscribe
- Mute
- Subscribe to RSS Feed
- Permalink
- Report Inappropriate Content
yes
- Mark as New
- Bookmark
- Subscribe
- Mute
- Subscribe to RSS Feed
- Permalink
- Report Inappropriate Content
May be helpful read Here: Gauges – QLIKIES
Using inbuilt LED images would be better option to show this traffic light display. use something like this:
Expression for Growth
= IF(CY/PY = 0.00, 'qmem://<bundled>/BuiltIn/led_o.png', IF(CY/PY > 0.00,'qmem://<bundled>/BuiltIn/led_g.png', IF(CY/PY < 0.00, 'qmem://<bundled>/BuiltIn/led_r.png')))
- Mark as New
- Bookmark
- Subscribe
- Mute
- Subscribe to RSS Feed
- Permalink
- Report Inappropriate Content
IS IT POSSIBLE TO MAKE A SELECTION ON THE TRAFFIC LIGHT SOMEHOW? For example i click on red and all related red are selected? also can i merge the value and the light together? the last two columns
- Mark as New
- Bookmark
- Subscribe
- Mute
- Subscribe to RSS Feed
- Permalink
- Report Inappropriate Content
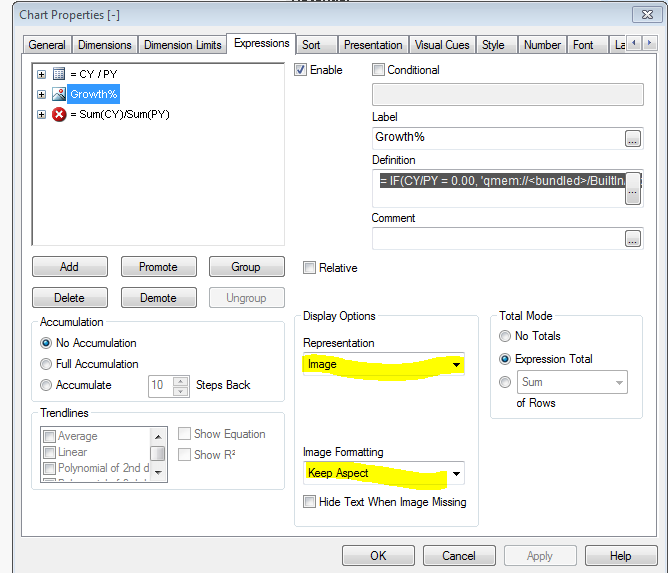
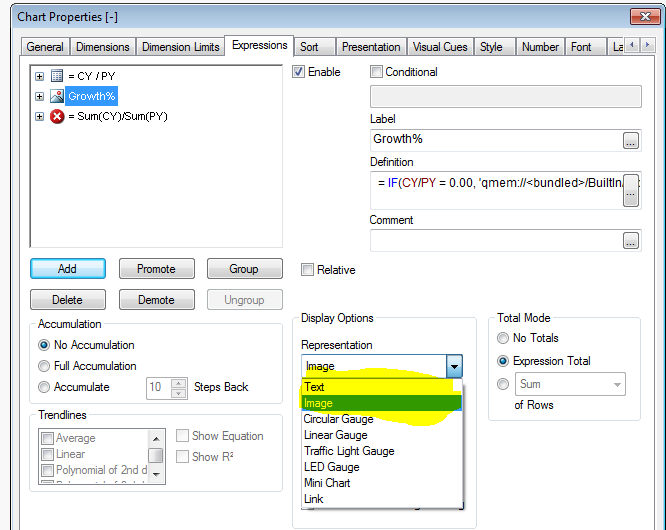
Unfortunately we do not have that facility to have value and Led Light in the same column coz if you see below we can select only one of them from the display options, i doubt if we have that option, hence new column.
- Mark as New
- Bookmark
- Subscribe
- Mute
- Subscribe to RSS Feed
- Permalink
- Report Inappropriate Content
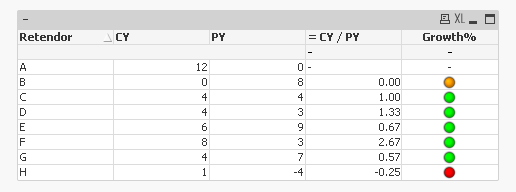
Ok may be you can create a flag in your script like
load *, IF(CY/PY = 0.00, 1, IF(CY/PY > 0.00, 2, IF(CY/PY < 0.0, 3))) AS ColorFlag inline [
Retendor, CY, PY
A,12,0
B,0,8
C,4,4
D,4,3
E,6,9
F,8,3
G,4,7
H,1,-4
];
Then use this color flag in a list box like below:
Add a dimension as expression
= Pick(Match(ColorFlag, 1, 2, 3), 'qmem://<bundled>/BuiltIn/led_o.png', 'qmem://<bundled>/BuiltIn/led_g.png', 'qmem://<bundled>/BuiltIn/led_r.png')
In Presentation tab Image Options select Image as representation and Image Formatting as Keep Aspect. You will have like this: