Unlock a world of possibilities! Login now and discover the exclusive benefits awaiting you.
- Qlik Community
- :
- All Forums
- :
- QlikView App Dev
- :
- Re: stack bar chart
- Subscribe to RSS Feed
- Mark Topic as New
- Mark Topic as Read
- Float this Topic for Current User
- Bookmark
- Subscribe
- Mute
- Printer Friendly Page
- Mark as New
- Bookmark
- Subscribe
- Mute
- Subscribe to RSS Feed
- Permalink
- Report Inappropriate Content
stack bar chart
Hi!
I have the following for my dimension and expressions:
Dimension:
YearMonth
Expressions:
Project Count=COUNT({<KO_DAY_KEY={'>0'}>} distinct [Project ID])
CycleTime=Avg(aggr(Avg(FIRST_CYCLE_TIME),[Project ID]))
I would like the Project Count which is in Bar chart to turn into a stack bar chart by different Statuses ('Completed', 'In Progress', 'Booked', etc). What's the correct expression for the status?
Example: Project Count total for Sept 2015 = 7; Wherein 3 = Booked, 3 = Completed and 1= Pending
Looking forward for your kind help.
Thanks.
- Mark as New
- Bookmark
- Subscribe
- Mute
- Subscribe to RSS Feed
- Permalink
- Report Inappropriate Content
question - what dimension contains the project status values?
Basically you will need to have 3 expressions - in your current expression add additional set analysis to include the status field and value (you will have 3). On the style tab, set to stacked
- Mark as New
- Bookmark
- Subscribe
- Mute
- Subscribe to RSS Feed
- Permalink
- Report Inappropriate Content
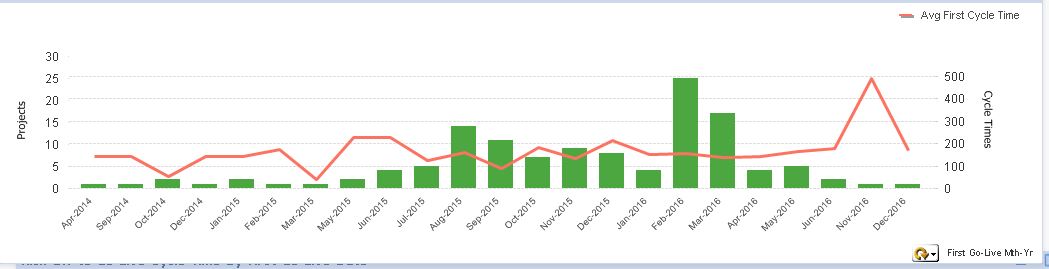
The Project status values is in the Dimension 'Status'. But I used dimension Go-Live Mth-Yr which is in cyclic group. This is how i want it to look like except for those bars need to be stacked bars by status.
- Mark as New
- Bookmark
- Subscribe
- Mute
- Subscribe to RSS Feed
- Permalink
- Report Inappropriate Content
sounds like your dimension needs to stay how you have it and then you will have 3 expressions - all 3 would be duplicates of the expression you have but would included additional set analysis check for Status
example
COUNT({<KO_DAY_KEY={'>0'} , Status = {Completed}>} distinct [Project ID])
COUNT({<KO_DAY_KEY={'>0'} , Status = {Booked}>} distinct [Project ID])
COUNT({<KO_DAY_KEY={'>0'} , Status = {Pending}>} distinct [Project ID])

- Mark as New
- Bookmark
- Subscribe
- Mute
- Subscribe to RSS Feed
- Permalink
- Report Inappropriate Content
It worked! Thank you Adam! I really appreciate your kind help. 