Unlock a world of possibilities! Login now and discover the exclusive benefits awaiting you.
- Qlik Community
- :
- All Forums
- :
- QlikView App Dev
- :
- show table with corresponding values on selection ...
- Subscribe to RSS Feed
- Mark Topic as New
- Mark Topic as Read
- Float this Topic for Current User
- Bookmark
- Subscribe
- Mute
- Printer Friendly Page
- Mark as New
- Bookmark
- Subscribe
- Mute
- Subscribe to RSS Feed
- Permalink
- Report Inappropriate Content
show table with corresponding values on selection of a dimension in bar chart with a particular color code
Hi ,
Is there any possible way to show a table with corresponding values on selection of a dimension in bar chart with a particular color code? Different color code bars are stacked and are made using expressions.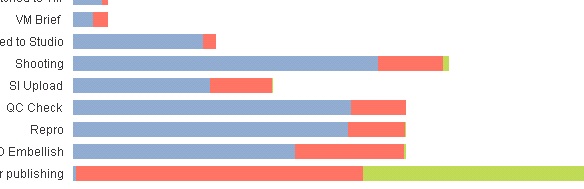
- Tags:
- new_to_qlikview
- Mark as New
- Bookmark
- Subscribe
- Mute
- Subscribe to RSS Feed
- Permalink
- Report Inappropriate Content
Sorry, can you explain more your expectative? Tx
- Mark as New
- Bookmark
- Subscribe
- Mute
- Subscribe to RSS Feed
- Permalink
- Report Inappropriate Content
Hi,
do you mean to show it as pivot table like
Dim1 Dim2 Exp
Shooting Blue value
Green value
Red value
Si Upload Blue value
Green value
Red value
- Mark as New
- Bookmark
- Subscribe
- Mute
- Subscribe to RSS Feed
- Permalink
- Report Inappropriate Content
You can't detect which bar segment was clicked. But you can show an additional table of details when a single Dimension is possible by using a show condition on the detail table like:
=Count(DISTINCT Dim1)=1
If you want to enhance the condition to only show when the Dim has a "green bar", repeat the expression that created the green segment. For example, if the green segment was "sum(Returns)"
=Count(DISTINCT Dim1)=1 AND Sum(Returns) > 0
I've updated this recipe to demonstrate showing object when a bar is clicked.
Qlikview Cookbook: Conditional Show of Details http://qlikviewcookbook.com/recipes/download-info/conditional-show-of-details/
-Rob
- Mark as New
- Bookmark
- Subscribe
- Mute
- Subscribe to RSS Feed
- Permalink
- Report Inappropriate Content
I just want to get a logic by which i can detect which stack of a bar (according to color) is selected(by click). Stacked bar is made using count expression and filtered by date.