Unlock a world of possibilities! Login now and discover the exclusive benefits awaiting you.
- Qlik Community
- :
- All Forums
- :
- QlikView App Dev
- :
- same expression in two different charts but gettin...
- Subscribe to RSS Feed
- Mark Topic as New
- Mark Topic as Read
- Float this Topic for Current User
- Bookmark
- Subscribe
- Mute
- Printer Friendly Page
- Mark as New
- Bookmark
- Subscribe
- Mute
- Subscribe to RSS Feed
- Permalink
- Report Inappropriate Content
same expression in two different charts but getting totals different
Hello All,
kindly suggest me what i am missing in my expression please
i have a straight table chart with
3- Dimensions: p_Material
VENDOR CODE
CATEGORY DESCRIPTION1
1- Expression:
sum(aggr(Avg({<BVALIDFROM={"<$(=Date(yearstart(today(),0,4),'DD-MM-YYYY'))"},BVALIDTO={">$(=Date(yearstart(today(),0,4),'DD-MM-YYYY'))"}>}distinct BPrice)*sum(VOLUME),p_Material,[VENDOR CODE]))
what i am doing is avg of BPrice * sum of Volume group by p_Material,Vendor code.......
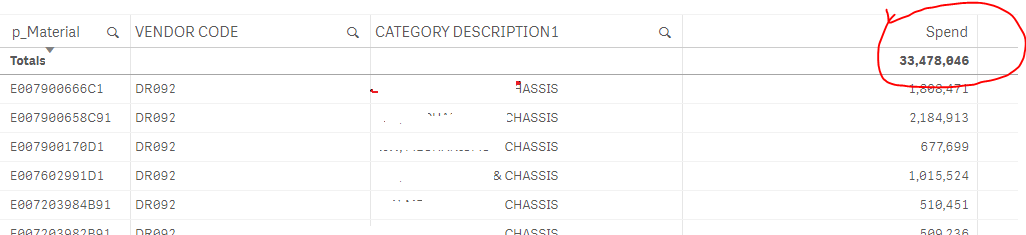
the Total i am getting is :33478046
when i tried to implement the same in bar chart with
1- Dimension : CATEGORY DESCRIPTION1
1- Expression(Same):
sum(aggr(Avg({<BVALIDFROM={"<$(=Date(yearstart(today(),0,4),'DD-MM-YYYY'))"},BVALIDTO={">$(=Date(yearstart(today(),0,4),'DD-MM-YYYY'))"}>}distinct BPrice)*sum(VOLUME),p_Material,[VENDOR CODE]))
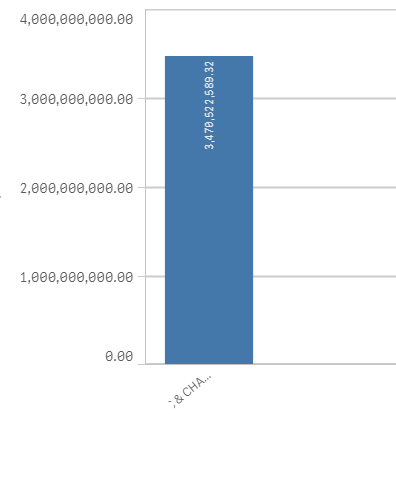
then Total i am getting is :3470522589.32
Even thought i am using the same expression and same dimension i am getting two different total .Is that because of aggregation?