Unlock a world of possibilities! Login now and discover the exclusive benefits awaiting you.
- Qlik Community
- :
- All Forums
- :
- QlikView App Dev
- :
- Re: last year month figure display in current mont...
- Subscribe to RSS Feed
- Mark Topic as New
- Mark Topic as Read
- Float this Topic for Current User
- Bookmark
- Subscribe
- Mute
- Printer Friendly Page
- Mark as New
- Bookmark
- Subscribe
- Mute
- Subscribe to RSS Feed
- Permalink
- Report Inappropriate Content
last year month figure display in current month
Hi forum, I'm in a deep puzzle.
Hope someone can lend me a hand. Thanks in advance!
Here's the story. I have the testing data as below.
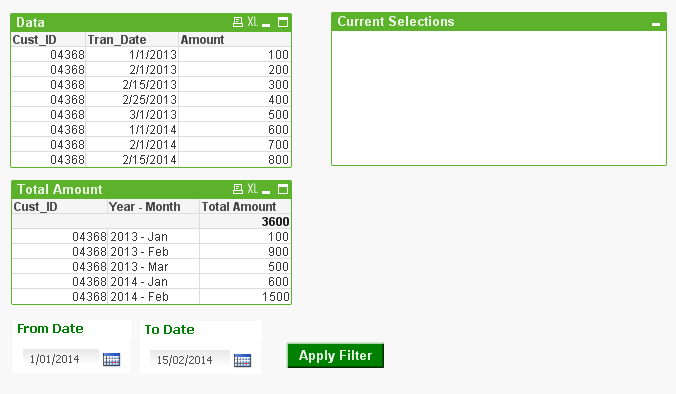
When I press apply filter button. it will set the filtering to retrieve data from 1/1/2014 ~ 2/15/2014.
How can I retrieve the last year figure and display at the same line.
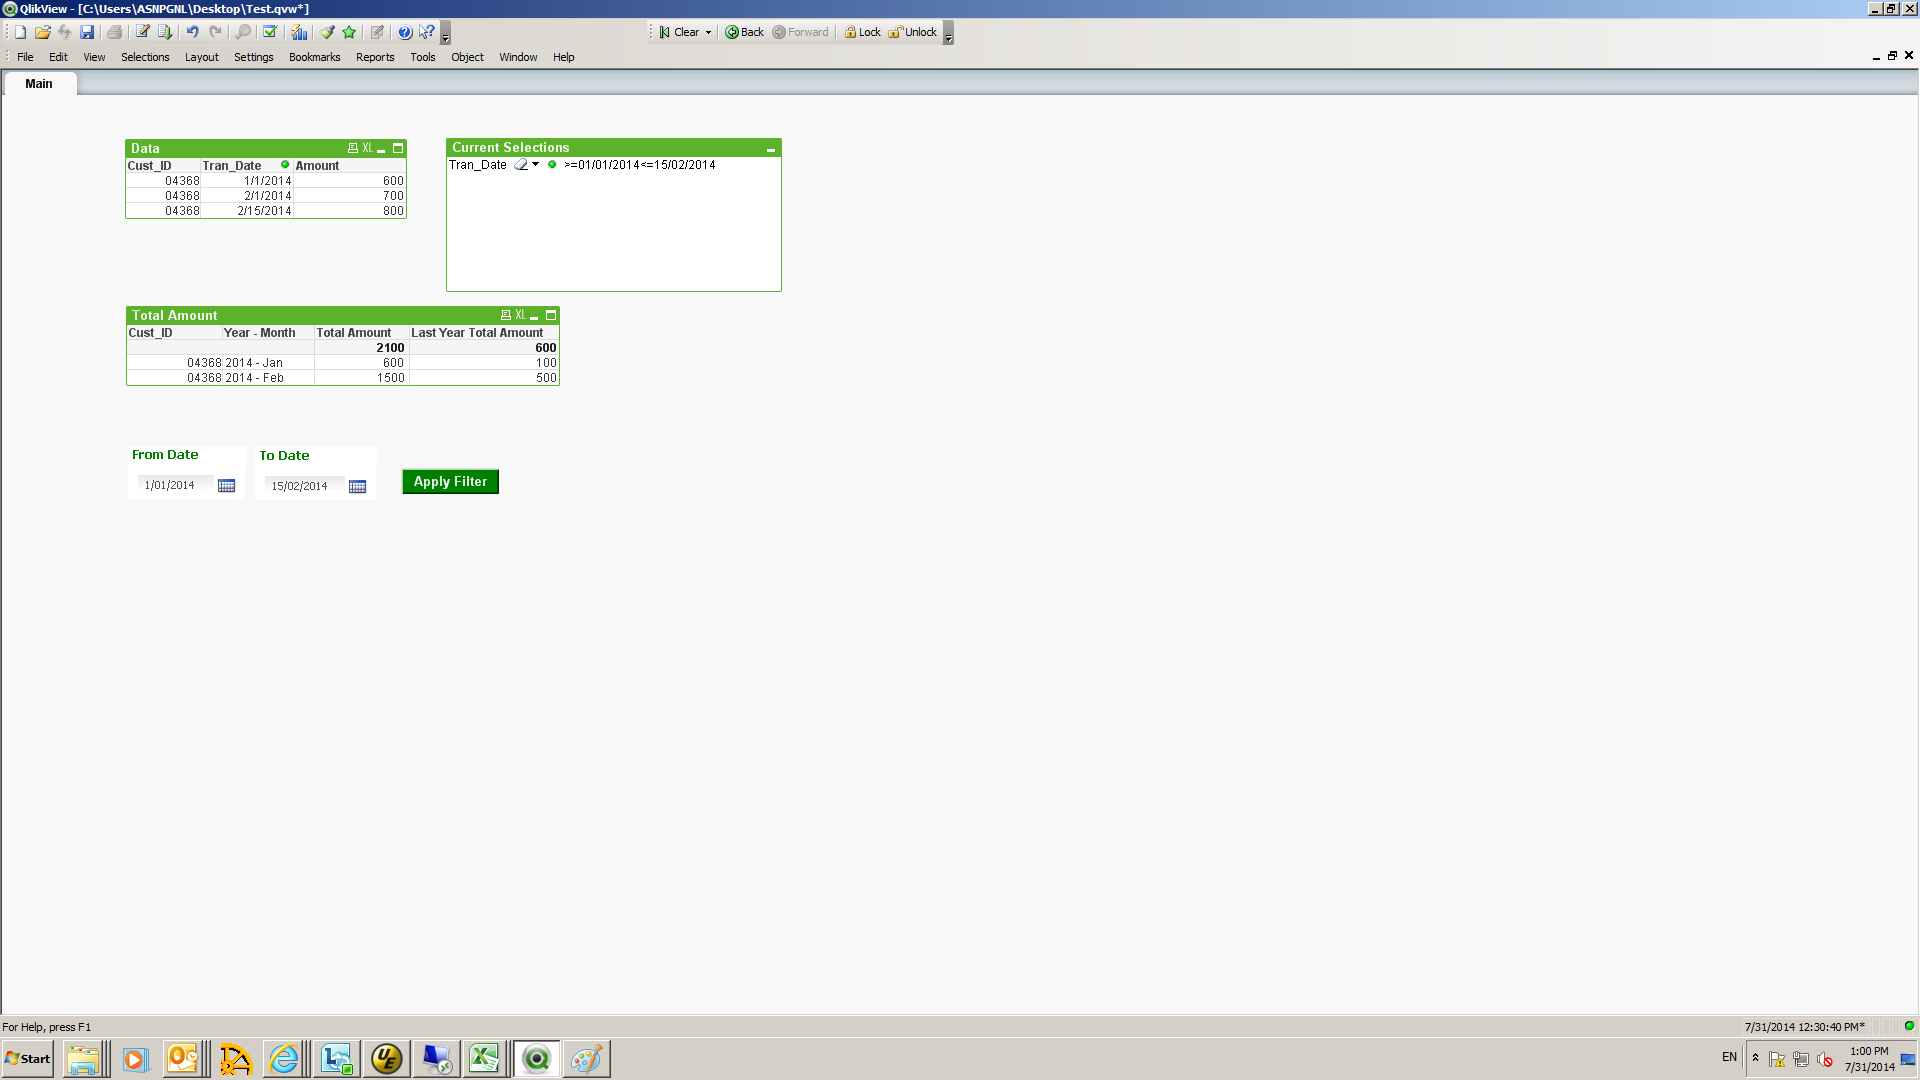
Below's what I expected.
- Mark as New
- Bookmark
- Subscribe
- Mute
- Subscribe to RSS Feed
- Permalink
- Report Inappropriate Content
Hey,
Here's something that might work for you.
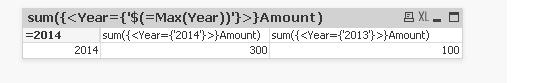
I've used a little trick in the generation of the calendar that allows you to calculate previous year figures in the same rows as current year figures. Please note that you will need to use set analysis in every expression if you decide to utilize this method.
Hope this helps 
-Teemu
- Mark as New
- Bookmark
- Subscribe
- Mute
- Subscribe to RSS Feed
- Permalink
- Report Inappropriate Content
have you seen my post
- Mark as New
- Bookmark
- Subscribe
- Mute
- Subscribe to RSS Feed
- Permalink
- Report Inappropriate Content
hi kelvin,
Chk d app
regardz,
Vaibz
- Mark as New
- Bookmark
- Subscribe
- Mute
- Subscribe to RSS Feed
- Permalink
- Report Inappropriate Content
Hi Kelvin
Allright then i think Teemu's approach is the correct one. You need to have flags for current and previous year and use sat analysis in your formula.
Didn't know that only months is not sufficient.
Kind regards,
Anthony
- Mark as New
- Bookmark
- Subscribe
- Mute
- Subscribe to RSS Feed
- Permalink
- Report Inappropriate Content
I should mention that. Anyway...thanks for your effort
- Mark as New
- Bookmark
- Subscribe
- Mute
- Subscribe to RSS Feed
- Permalink
- Report Inappropriate Content
Hi --,
I don't want to display 2013 data. Anyway, thanks!
- Mark as New
- Bookmark
- Subscribe
- Mute
- Subscribe to RSS Feed
- Permalink
- Report Inappropriate Content
I need to have year & month. Sorry I have little idea about your talking
- Mark as New
- Bookmark
- Subscribe
- Mute
- Subscribe to RSS Feed
- Permalink
- Report Inappropriate Content
Hi Teemu,
The table has more than 10 million records, use current/past flag will increase the data amount to double. Are there any other approach? Like "above" or somthing?
- Mark as New
- Bookmark
- Subscribe
- Mute
- Subscribe to RSS Feed
- Permalink
- Report Inappropriate Content
Does anybody know are there any approaches something like "above" can retrieve last year figure and show them in the same row of current month? Add current/last year flag will increase the data volumn to double.
Thanks!
- Mark as New
- Bookmark
- Subscribe
- Mute
- Subscribe to RSS Feed
- Permalink
- Report Inappropriate Content
Hi,
The amount of rows should not change since the calendar table is separated from the fact data. It should only have as many rows as there are dates between the min and max dates of your data set, multiplied by 2.
edit: if you take a look at the amount of rows in the fact table of your Test application, it still has only 8 rows, just as you've defined in the load even if there are current/previous flags in the calendar table.
-Teemu