Unlock a world of possibilities! Login now and discover the exclusive benefits awaiting you.
- Qlik Community
- :
- All Forums
- :
- QlikView App Dev
- :
- i want to change the format ( structure)
- Subscribe to RSS Feed
- Mark Topic as New
- Mark Topic as Read
- Float this Topic for Current User
- Bookmark
- Subscribe
- Mute
- Printer Friendly Page
- Mark as New
- Bookmark
- Subscribe
- Mute
- Subscribe to RSS Feed
- Permalink
- Report Inappropriate Content
i want to change the format ( structure)
Hi Guys,
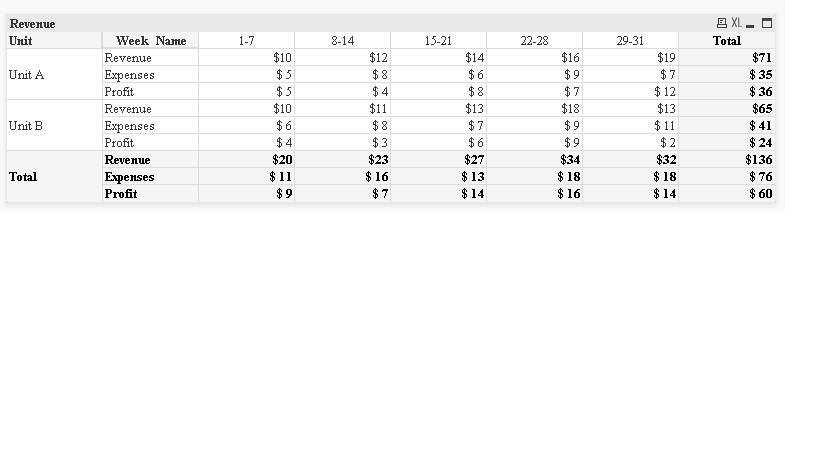
Please find the attachement, i need to display Unit A under Revenue , Expense , Profit same like Unit B and Total.
Can any pls help me
BR
Janardhan
- Mark as New
- Bookmark
- Subscribe
- Mute
- Subscribe to RSS Feed
- Permalink
- Report Inappropriate Content
Hi,
Can you send us your data in excel sheet file?
Regards,
Sokkorn
- Mark as New
- Bookmark
- Subscribe
- Mute
- Subscribe to RSS Feed
- Permalink
- Report Inappropriate Content
thanks for quick reply
- Mark as New
- Bookmark
- Subscribe
- Mute
- Subscribe to RSS Feed
- Permalink
- Report Inappropriate Content
Hi Janardan,
Please see if the attached qvw helps.
Thanks
Amar
- Mark as New
- Bookmark
- Subscribe
- Mute
- Subscribe to RSS Feed
- Permalink
- Report Inappropriate Content
hi amar ,
my requirement is like as in the attachement ( Task image)
- Mark as New
- Bookmark
- Subscribe
- Mute
- Subscribe to RSS Feed
- Permalink
- Report Inappropriate Content
Hi,
I think this one can be done by script. Let try:
A. Load data
[tmpData]:
CrossTable(TransDate, Amt, 2)
LOAD
Unit,
TransDate As tmpTranDate,
Revenue,
Expense,
Revenue - Expense AS Profit
FROM [Output.xlsx]
(ooxml, embedded labels, table is Sheet1);
RENAME FIELD
TransDate TO Types,
tmpTranDate TO TransDate;
[Data]:
LOAD
Unit,
TransDate,
WEEK(TransDate) AS TranWeek,
Types,
Amt
RESIDENT [tmpData];
DROP TABLE [tmpData];
[TranType]:
LOAD fieldvalue('Unit',iterno()) as Unit
AUTOGENERATE 1
WHILE len(fieldvalue('Unit',iterno()));
Totals:
LOAD
'Total' as TypeGroup,
Unit
RESIDENT TranType;
CONCATENATE (Totals)
LOAD
Unit as TypeGroup,
Unit
RESIDENT TranType;
DROP TABLE TranType;
B. Create Pivot Table with:
1. Dimension: TypeGroup, Types,TranWeek
2. Expression: SUM(Amt)
C. Drag TranWeek to horizontal (for pivot)
See the sample attached file.
Hope this help and do let me know.
Regards,
Sokkorn
- Mark as New
- Bookmark
- Subscribe
- Mute
- Subscribe to RSS Feed
- Permalink
- Report Inappropriate Content
thanks for ur valuable time spending , exactly my requirement is i dont want separate column Unit
i need like this , i dont want any logic, in front-end i need to display
UnitA Date 01-07 08-14 - - -
Revenue - - - -
Expense - - - -
Profit - - - -
UnitB
.
.
.
Total
.
.
.
Plz help me its an urgent
- Mark as New
- Bookmark
- Subscribe
- Mute
- Subscribe to RSS Feed
- Permalink
- Report Inappropriate Content
Hi,
Sorry that not get back you soon. Because I leave the office since last reply you. I'm curious to know why you need this templat? Is it your customer requirement? To achieve this template, I think we need lots of data modeling in script and cause of load performance if you have big data.
Regards,
Sokkorn