Unlock a world of possibilities! Login now and discover the exclusive benefits awaiting you.
- Qlik Community
- :
- All Forums
- :
- QlikView App Dev
- :
- how to show the comparison between current month a...
- Subscribe to RSS Feed
- Mark Topic as New
- Mark Topic as Read
- Float this Topic for Current User
- Bookmark
- Subscribe
- Mute
- Printer Friendly Page
- Mark as New
- Bookmark
- Subscribe
- Mute
- Subscribe to RSS Feed
- Permalink
- Report Inappropriate Content
how to show the comparison between current month and first month
Hi Team,
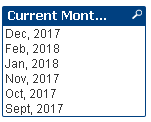
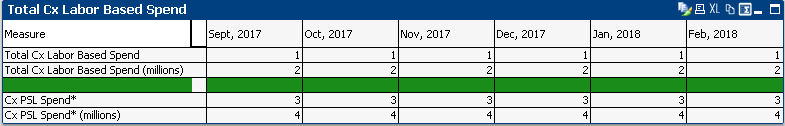
In Dashboard1 I need one more column after average to show the % difference between Current month (Feb 2018) and first month(Sept 2017)
Current month should change dynamically as soon the new month gets inserted
And also i want only few rows dashboard1 based on the all metrics shown in dashboard 2
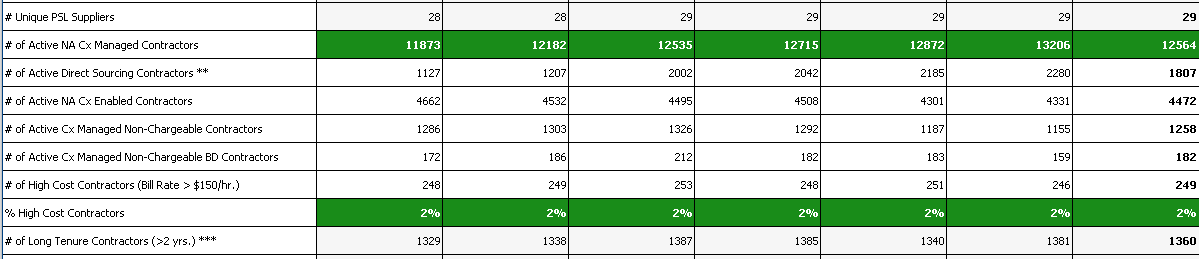
For example i want highlight entire rows containing # of active CX managed contractors
How can i round of the value in average column to without decimals?
Attached the qvw file
- « Previous Replies
-
- 1
- 2
- Next Replies »
- Mark as New
- Bookmark
- Subscribe
- Mute
- Subscribe to RSS Feed
- Permalink
- Report Inappropriate Content
can someone help me on this please?
- Mark as New
- Bookmark
- Subscribe
- Mute
- Subscribe to RSS Feed
- Permalink
- Report Inappropriate Content
I suggest you to remove company Logo from dashboard and share. That is not good practice. Can you tell us which sheet and where you want to add one more column?
- Mark as New
- Bookmark
- Subscribe
- Mute
- Subscribe to RSS Feed
- Permalink
- Report Inappropriate Content
Hi Anil babu,
I want add in dashboard 1 comparison column next to average columns as shown in the excel sheet
How can highlight the entire row in Dashaboard 1 containing label # of Active NA Cx Managed Contractors
and % High Cost Contractors?
Can you please help?
Regards,
Savithri
- Mark as New
- Bookmark
- Subscribe
- Mute
- Subscribe to RSS Feed
- Permalink
- Report Inappropriate Content
Hi Team,
Requesting you to help?
Regards,
Savithri
- Mark as New
- Bookmark
- Subscribe
- Mute
- Subscribe to RSS Feed
- Permalink
- Report Inappropriate Content
Hi Savithri,
Create two variables 1 for min and 1 for max
vMin= Text(Min(Date(Date#([Current Month/Year],'MMM, YYYY'),'MMM, YYYY')))
vMax=Text(Max(Date(Date#([Current Month/Year],'MMM, YYYY'),'MMM, YYYY')))
Date is in text format, you can convert it to number in script itself or you can use the above expression which is in text format.
Use below expression for Comparision:
= Sum({<[Current Month/Year]={'$(vMin)'}>}[Spend USD])-Sum({<[Current Month/Year]={'$(vMax)'}>}[Spend USD])
Qlikview date format will consider only "MMM YYYY", hence vMin will consider the Oct 2017 as first date, because Sept, 2017 is excluded you can use the below expression or you can fix the date format to Sep, 2017 in script.
vMin=Text(Min(Date(Date#(left(SubField([Current Month/Year],',',1),3)&','&SubField([Current Month/Year],',',2),'MMM, YYYY'),'MMM, YYYY')))
Hope this helps.
Thanks,
Pooja
- Mark as New
- Bookmark
- Subscribe
- Mute
- Subscribe to RSS Feed
- Permalink
- Report Inappropriate Content
One way could be using Valuelist() like this? PFA
- Mark as New
- Bookmark
- Subscribe
- Mute
- Subscribe to RSS Feed
- Permalink
- Report Inappropriate Content
Or something like this? Correct me if i am understand in weird direction?
- Mark as New
- Bookmark
- Subscribe
- Mute
- Subscribe to RSS Feed
- Permalink
- Report Inappropriate Content
Hi Pooja,
I tried in dashboard 3. Can you please help? its not working
I want 3 columns Which shows the metrics name Total Spend, First month, Current month, Comparision
Regards,
Savithri
- Mark as New
- Bookmark
- Subscribe
- Mute
- Subscribe to RSS Feed
- Permalink
- Report Inappropriate Content
Hi Anil,
Thank you this helps. Can you please tell me how to do this?
Regards,
Savithri
- « Previous Replies
-
- 1
- 2
- Next Replies »