Unlock a world of possibilities! Login now and discover the exclusive benefits awaiting you.
- Qlik Community
- :
- All Forums
- :
- QlikView App Dev
- :
- how to show percentage contribution in the bar cha...
- Subscribe to RSS Feed
- Mark Topic as New
- Mark Topic as Read
- Float this Topic for Current User
- Bookmark
- Subscribe
- Mute
- Printer Friendly Page
- Mark as New
- Bookmark
- Subscribe
- Mute
- Subscribe to RSS Feed
- Permalink
- Report Inappropriate Content
how to show percentage contribution in the bar chart
Hi,
How can i show the Mon to Sun bar chart, the percentage contribution of the total for each Day of the Week
Thanks
- Tags:
- new_to_qlikview
- Mark as New
- Bookmark
- Subscribe
- Mute
- Subscribe to RSS Feed
- Permalink
- Report Inappropriate Content
Not sure what you are trying to achieve.
In general, you can use your aggregation with a TOTAL qualifier or TOTAL<DIMFIELD1, DIMFIELD2> qualifier to calculate your aggregated values across dimensional borders.
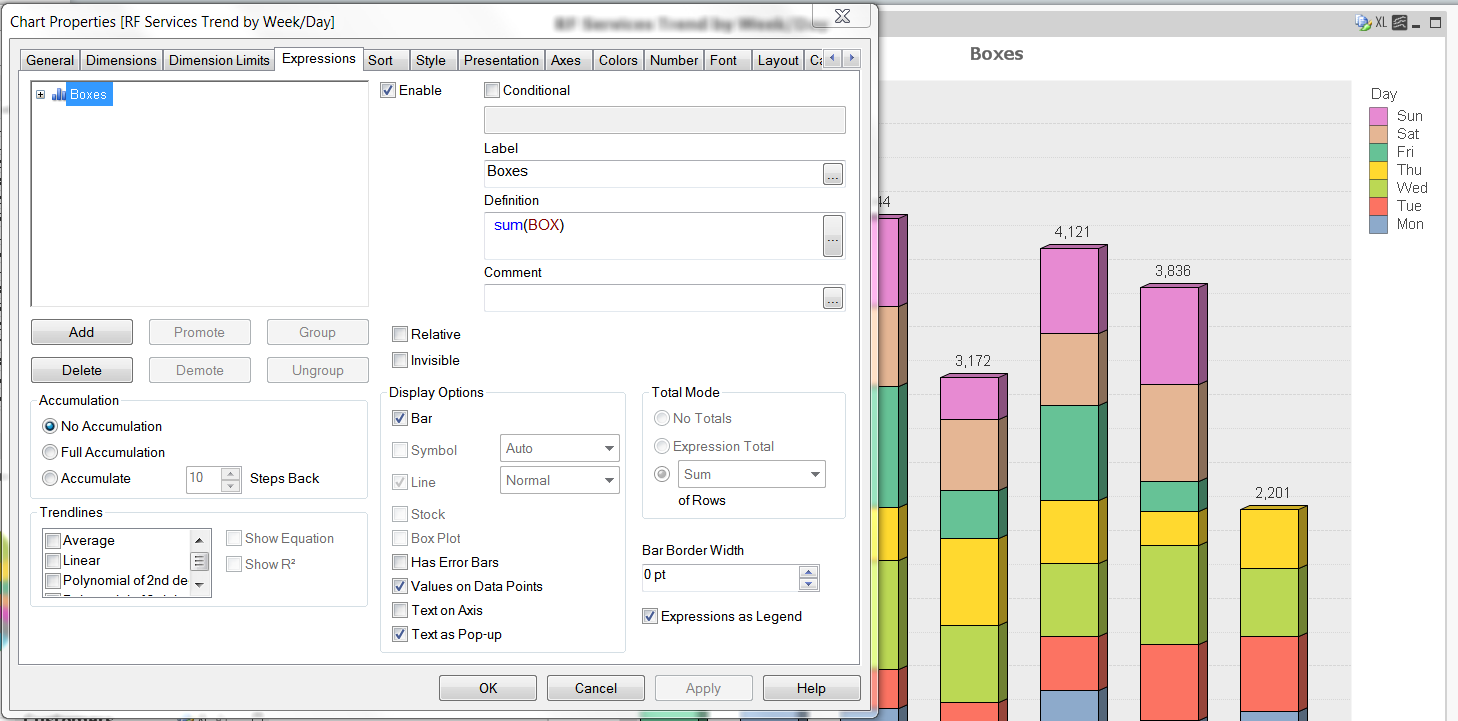
Assuming you are showing SUM(BOX) with two dimensions, WEEK and DAY, you can use
=Num( SUM(BOX) / SUM(TOTAL<WEEK> BOX), '#0.00%','.',',')
to show the percentage distribution of measure SUM(BOX) in a WEEK per DAY (so all percentages of a WEEK result in 100%)
Or
=Num( SUM(BOX) / SUM(TOTAL BOX), '#0.00%','.',',')
to show percentages in your chart that sum up to overall 100%.
- Mark as New
- Bookmark
- Subscribe
- Mute
- Subscribe to RSS Feed
- Permalink
- Report Inappropriate Content
Hi,
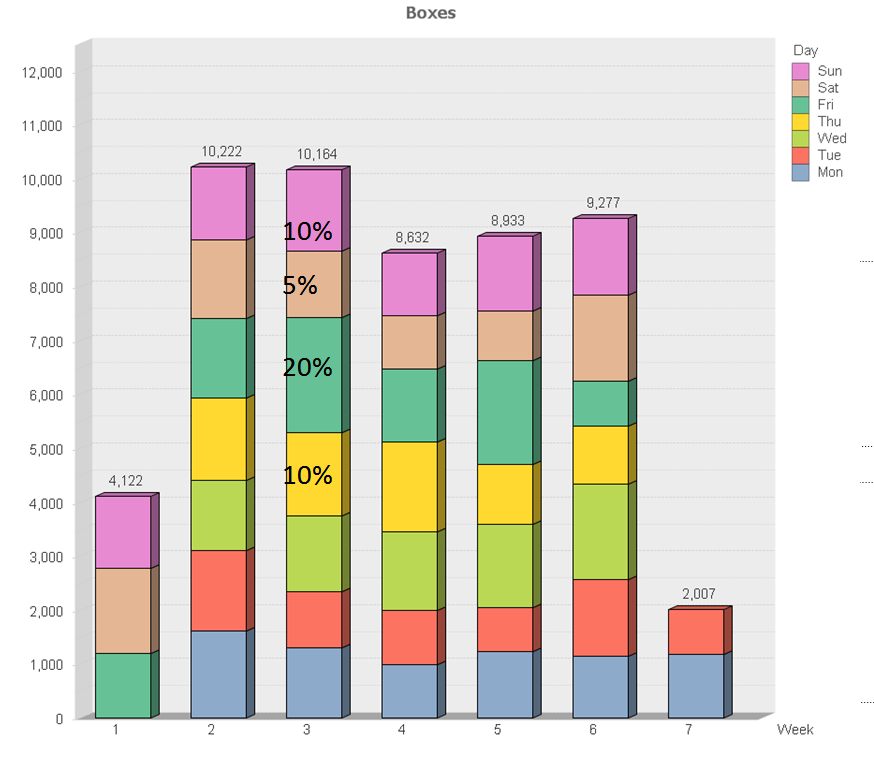
Actually i trying to show this for the Day bar
1. Total boxes for the Week.
2. Percentage contribution for the Day
So all percentages of a Day result in 100%.
Pls see the attached edited image sample.
BtW: =Num( SUM(BOX) / SUM(TOTAL<WEEK> BOX), '#0.00%','.',',') gives me "Exceeded allocated memory" error
Thanks
- Mark as New
- Bookmark
- Subscribe
- Mute
- Subscribe to RSS Feed
- Permalink
- Report Inappropriate Content
anyone please?