Unlock a world of possibilities! Login now and discover the exclusive benefits awaiting you.
- Qlik Community
- :
- All Forums
- :
- QlikView App Dev
- :
- how to categorised sales wise in bar chat , when w...
- Subscribe to RSS Feed
- Mark Topic as New
- Mark Topic as Read
- Float this Topic for Current User
- Bookmark
- Subscribe
- Mute
- Printer Friendly Page
- Mark as New
- Bookmark
- Subscribe
- Mute
- Subscribe to RSS Feed
- Permalink
- Report Inappropriate Content
how to categorised sales wise in bar chat , when we take 1 dimmension
Hi Friends,
Actually my requirement is how to segregate data in bar charts :
i.e suppose i have 10 sales columns are there in that it should get sales wise different colours on the bar.
brief example we will do at back ground colour like
if <col> rgb 255,123,244
like that , I don t know exact process could you help on this.
- Mark as New
- Bookmark
- Subscribe
- Mute
- Subscribe to RSS Feed
- Permalink
- Report Inappropriate Content
You can try something like: Color(RowNo())
- Mark as New
- Bookmark
- Subscribe
- Mute
- Subscribe to RSS Feed
- Permalink
- Report Inappropriate Content
You can use this well on this
Color(FieldIndex('Sales',Sales))
- Mark as New
- Bookmark
- Subscribe
- Mute
- Subscribe to RSS Feed
- Permalink
- Report Inappropriate Content
Hi Srinivas,
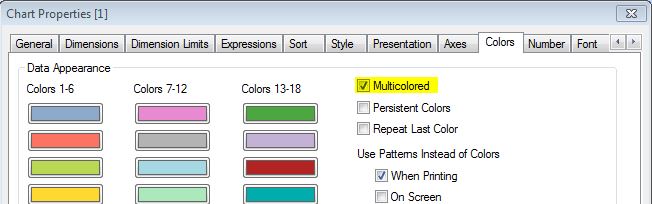
i hope you already got 10 bars in a bar chart with same color.but you want different colors for each bar so right click on bar chart and go to colors tab in Data Appearance
Check the check box Multi color.
- Mark as New
- Bookmark
- Subscribe
- Mute
- Subscribe to RSS Feed
- Permalink
- Report Inappropriate Content
Hi Ram,
I think you couldn't get my Question ?
suppose i have sales table i want display on Bar chart which contain 1 Dim and 1 measure.
I would like to display sales wise each Bar(cell) in multiple colors, Suppose
there are 2 Axis are there
one is X axis and another one is Y Axis.

In above table We have Sales and Country, according to Sales Graph Should be display Multi color's ?
Suppose take Germany as Example for that i want to display ( 0 to 100) one color
and 101 to 200) another color on the bar.
I have little bit idea
if(sales>100,rgb(0,255,255) is it work ?
please give me brief description on this....
regards,
Siva