Unlock a world of possibilities! Login now and discover the exclusive benefits awaiting you.
- Qlik Community
- :
- All Forums
- :
- QlikView App Dev
- :
- drawing a bar chart which it dimension include 5 ...
- Subscribe to RSS Feed
- Mark Topic as New
- Mark Topic as Read
- Float this Topic for Current User
- Bookmark
- Subscribe
- Mute
- Printer Friendly Page
- Mark as New
- Bookmark
- Subscribe
- Mute
- Subscribe to RSS Feed
- Permalink
- Report Inappropriate Content
drawing a bar chart which it dimension include 5 main groups and two maximum of the last group
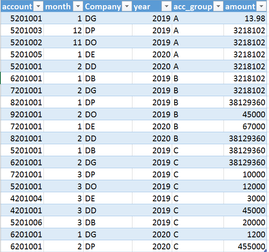
Hi all, I have a dataset like below picture which includes some account and their groups, periods, and their amounts and I would like to draw a bar chart which it's dimension include the sum of my 3 main account group in each year plus two maximum sums of account in the third group, then drill down to company, is there any way to extract the two maximum account from the third group and draw them beside the three main group?
My chart should include sums of amounts of group A, B and C for each year, and sums of the maximum amount of two accounts in group C
- Mark as New
- Bookmark
- Subscribe
- Mute
- Subscribe to RSS Feed
- Permalink
- Report Inappropriate Content
Best I have as a point in the possible right direction is the following, not sure if it will work or not, but pretty sure that is where you need to head with this one.
Here is the base URL to the Design Blog area if you want to do some further searching on your own:
https://community.qlik.com/t5/Qlik-Design-Blog/bg-p/qlik-design-blog
Regards,
Brett
I now work a compressed schedule, Tuesday, Wednesday and Thursday, so those will be the days I will reply to any follow-up posts.
