Unlock a world of possibilities! Login now and discover the exclusive benefits awaiting you.
- Qlik Community
- :
- All Forums
- :
- QlikView App Dev
- :
- YTD in chart for every month
- Subscribe to RSS Feed
- Mark Topic as New
- Mark Topic as Read
- Float this Topic for Current User
- Bookmark
- Subscribe
- Mute
- Printer Friendly Page
- Mark as New
- Bookmark
- Subscribe
- Mute
- Subscribe to RSS Feed
- Permalink
- Report Inappropriate Content
YTD in chart for every month
Hello all,
I have a table in QV which gives the sales figures for products A,B and C, in the next time periods;
- monthly (period)
- Year to date (YTD)
- Moving anual Total (MAT)
See the Sales_Table
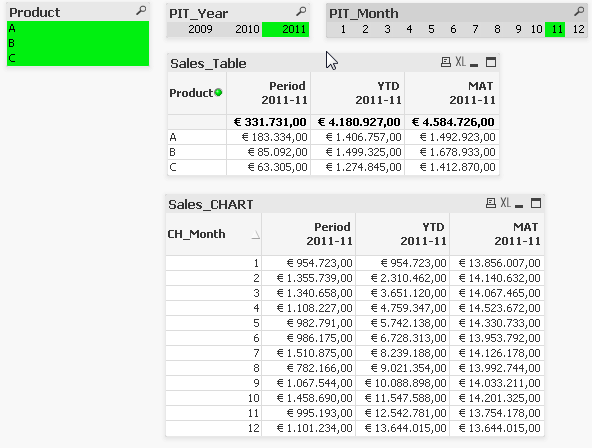
Now I want to create a Chart with each value for every month, So in this example For CH_Month=10 the value for Period should be 331.731,-, for YTD 4.180.927,- and for MAT 4.584.726,-
Somehow the values in 'Sales_Chart' are multiplied with a factor, can anyone help me out here? Thanks in advance! See the attached QV example
Accepted Solutions
- Mark as New
- Bookmark
- Subscribe
- Mute
- Subscribe to RSS Feed
- Permalink
- Report Inappropriate Content
Found a solution, see the attached file.
- Mark as New
- Bookmark
- Subscribe
- Mute
- Subscribe to RSS Feed
- Permalink
- Report Inappropriate Content
Found the solution i used a sum function in the Sales_Chart if I make it a Sum Distinct the problem is solved. See attached file
- Mark as New
- Bookmark
- Subscribe
- Mute
- Subscribe to RSS Feed
- Permalink
- Report Inappropriate Content
The initial problem I see is that CH_Month & PIT_Month aren't tied to anything. Change the Time table in your load script to something like this so that QV can relate the dates to each other.
Time:
LOAD Date,
Day,
Month,
Year,
Date as PIT_Date,
Date as CH_Date
FROM
C:\Users\Kadenza\Documents\VoorbeeldData.xlsx
(ooxml, embedded labels, table is Time);
- Mark as New
- Bookmark
- Subscribe
- Mute
- Subscribe to RSS Feed
- Permalink
- Report Inappropriate Content
That is not the problem. the PointInTime table for example (PIT) is created to calculate YTD and MAT values, or do you have another solution to do this?
- Mark as New
- Bookmark
- Subscribe
- Mute
- Subscribe to RSS Feed
- Permalink
- Report Inappropriate Content
Sum Distinct is a solution in this case, but it is not when two rows have the same sales data
- Mark as New
- Bookmark
- Subscribe
- Mute
- Subscribe to RSS Feed
- Permalink
- Report Inappropriate Content
Can anyone help me out here!?
- Mark as New
- Bookmark
- Subscribe
- Mute
- Subscribe to RSS Feed
- Permalink
- Report Inappropriate Content
I think the attached example will get you closer to where you need to go.
- Mark as New
- Bookmark
- Subscribe
- Mute
- Subscribe to RSS Feed
- Permalink
- Report Inappropriate Content
It is getting closer, but still not the answer, you can do a single period and YTD but I do not see how to do the MAT in this example.
Anyone an idea
- Mark as New
- Bookmark
- Subscribe
- Mute
- Subscribe to RSS Feed
- Permalink
- Report Inappropriate Content
You should be able to just adjust the values in the YTD rangesum calc to match the period for your MAT.
- Mark as New
- Bookmark
- Subscribe
- Mute
- Subscribe to RSS Feed
- Permalink
- Report Inappropriate Content
Found a solution, see the attached file.