Unlock a world of possibilities! Login now and discover the exclusive benefits awaiting you.
- Qlik Community
- :
- All Forums
- :
- QlikView App Dev
- :
- Re: Weighted average
- Subscribe to RSS Feed
- Mark Topic as New
- Mark Topic as Read
- Float this Topic for Current User
- Bookmark
- Subscribe
- Mute
- Printer Friendly Page
- Mark as New
- Bookmark
- Subscribe
- Mute
- Subscribe to RSS Feed
- Permalink
- Report Inappropriate Content
Weighted average
Good afternoon people. I have a hard-to-solve analysis for me.
I have the table below:
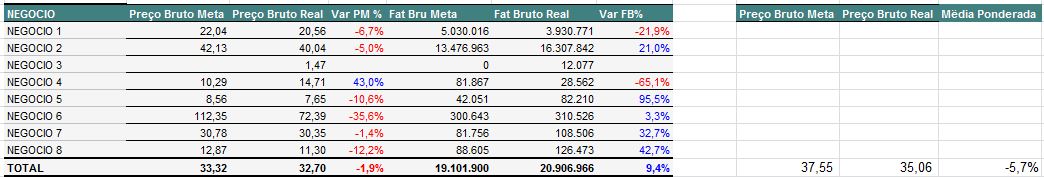
I have in the first columns the target price and real price. Following is the simple variation between them. At the end of the picture, I have the weighted average price of these deals, which is 37.55 and 35.06. To reach these values was used the formula SOMARPODUTO of excel. It makes the target price x the fat goal and divides by the total (19,101,900).
I'm trying to do this in Qlikview and I'm not getting it.
Can anyone help me with this question?
Thank you
Wagner
- Mark as New
- Bookmark
- Subscribe
- Mute
- Subscribe to RSS Feed
- Permalink
- Report Inappropriate Content
Can you share a sample file and expressions your are using in your Excel to get those final values?
- Mark as New
- Bookmark
- Subscribe
- Mute
- Subscribe to RSS Feed
- Permalink
- Report Inappropriate Content
What you have tried in formula qlikview. Or may be i didn't understand you. Can you describe more
Sum({<[fat goal] = {'x'}>} [target price])/Sum(Total [Fat Bru Meta])
Or
Sum( Total <[fat goal]> [target price])/Sum(Total [Fat Bru Meta])
- Mark as New
- Bookmark
- Subscribe
- Mute
- Subscribe to RSS Feed
- Permalink
- Report Inappropriate Content
Weighted averaging is very straightforward in Qlik. the old "excel function" of sumproduct is no longer relevant.
here is an example:
=(Sum(rate)*sum(balance))/sum(balance)
or
=(Sum(metric)*sum(metric that weight is based on))/sum(metric that weight is based on)
it no longer matters what you have selected or which dimensions show up in the chart object....it just works.