Unlock a world of possibilities! Login now and discover the exclusive benefits awaiting you.
- Qlik Community
- :
- All Forums
- :
- QlikView App Dev
- :
- Trigger to Filter data
- Subscribe to RSS Feed
- Mark Topic as New
- Mark Topic as Read
- Float this Topic for Current User
- Bookmark
- Subscribe
- Mute
- Printer Friendly Page
- Mark as New
- Bookmark
- Subscribe
- Mute
- Subscribe to RSS Feed
- Permalink
- Report Inappropriate Content
Trigger to Filter data
Hi! I have been trying to find a solution to this problem but to no avail! Anyone with ideas?Or is this not possible?
Data:
Year Date Store Sales
2014 1/1/2014 A 10
2014 1/3/2014 A 20
2015 1/4/2015 A 70
2015 1/6/2015 A 10
2014 1/2/2014 A 30
2015 1/8/2014 A 20
2014 1/1/2014 B 10
2014 1/3/2014 B 20
2015 1/4/2015 B 70
2015 1/6/2015 B 10
2014 1/2/2014 B 30
2015 1/8/2014 B 20
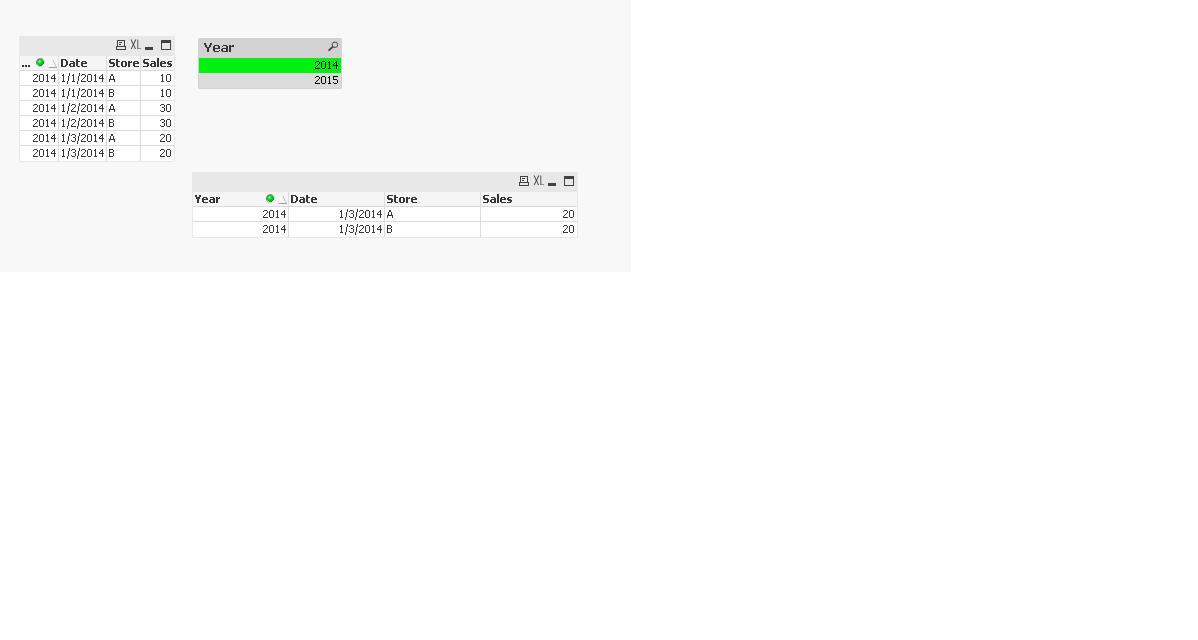
When I pick a Year, I want data to filter to only show latest dates per store, and sum sales for this.
For ex: Pick Year in list box= 2014 , Data should filter to this:
Year Date Store Sales
2014 1/3/2014 A 20
2014 1/3/2014 B 20
I have tried triggers and aggr, but no success!
Please help!Thanks in advance!
- Mark as New
- Bookmark
- Subscribe
- Mute
- Subscribe to RSS Feed
- Permalink
- Report Inappropriate Content
See if the attached will help...
- Mark as New
- Bookmark
- Subscribe
- Mute
- Subscribe to RSS Feed
- Permalink
- Report Inappropriate Content
For the Sales, use the expression:
=Sum(Aggr(FirstSortedValue(Sales,-Date), Store, Year))
If you want to show the corresponding Date in the chart, use
Date(Max(Date))
as either an expression or a calculated dimension.
-Rob
- Mark as New
- Bookmark
- Subscribe
- Mute
- Subscribe to RSS Feed
- Permalink
- Report Inappropriate Content
Hi Rob!
Thank you so much for ur response! I tried this and its not working in my application.I have attached my qvw and the data.As you will see, it is returning sales 0 in the table.Any ideas please?
Thanks in Advance! !
- Mark as New
- Bookmark
- Subscribe
- Mute
- Subscribe to RSS Feed
- Permalink
- Report Inappropriate Content
You could also create a (1 or 0) flag in your load script to identify which record by store and year is the most recent one. Then your expression because simple sum(Sales*Flag) .
Whichever way you do it,I think you want the aggregate to the lowest level of granularity that you're going to display in your chart.
In the qvw you attached, your lowest level of granualarity displayed in the pivot table where you're using Rob's formula is actually [Store No] not [Store]. I believe that is why you're having problems utilizing it.
- Mark as New
- Bookmark
- Subscribe
- Mute
- Subscribe to RSS Feed
- Permalink
- Report Inappropriate Content
Hi Guilibaldo,
Thanks for you response.Yes, I did notice that it is working only at the lowest level of hierarchy.However, my requirement is that it needs to work on an intermediate level as well.
Regarding using a flag, I did try this but i ran into an issue.My application should work such that if I select 2 out of 3 years, data should filter out such that only the latest dates for each Store No should be present and the sales should reflect the same.Also another situation: a Store No might not have a sale in 2016, but might have in 2015.So I felt the Flag system would not work. Unless you have a slightly different approach in mind?Please do let me know!
I am starting to lose hope that this is even possible to implement in Qlikview!Any help is much appreciated! Thanks in advance!
- Mark as New
- Bookmark
- Subscribe
- Mute
- Subscribe to RSS Feed
- Permalink
- Report Inappropriate Content
Adil,
It sounds like you want a different expression for each level you might display.
If you're going to show these different values and different levels of detail in different charts, you can do it. Each one just becomes a separate expression with it's own calculation. Again it's the lowest level of granualarity displayed within your chart. If your lowest level in a chart is Store then you create your expression based on that. If it is Store No, then you create your expression based on that.
However, if you think the expression is going to change based on whether you have a field expanded in a pivot table or not, then I'd have to agree with you that I don't think that's possible.
- Mark as New
- Bookmark
- Subscribe
- Mute
- Subscribe to RSS Feed
- Permalink
- Report Inappropriate Content
Using your example chart, the expression qould be:
=Sum(Aggr(FirstSortedValue(Sales,-VisitDate), [Store No]))
You'll want to aggregate over [Store no].
-Rob
- Mark as New
- Bookmark
- Subscribe
- Mute
- Subscribe to RSS Feed
- Permalink
- Report Inappropriate Content
Hi Rob,
I need to find the latest dates by store and not Store No...Is there anyway to do this?Any help is much appreciated!Thanks in advance!
- Mark as New
- Bookmark
- Subscribe
- Mute
- Subscribe to RSS Feed
- Permalink
- Report Inappropriate Content
Adil,
It really sounds like you're looking for different expression calculation based on what dimensions are expanded in a pivot table.
If that's the case, as I thought about it the only other thing I could suggest is to use Dimensionality().
Dimensionality will tell you how many dimensions are expanded in a pivot table row.
So then in your expression you could do something like if(Dimensionality()=5, Expression1,Expression2).
I've never implemented something like that so but it should work.
That said, I have no idea what performance on something like that would be.
Good luck.