Unlock a world of possibilities! Login now and discover the exclusive benefits awaiting you.
- Qlik Community
- :
- All Forums
- :
- QlikView App Dev
- :
- Straight table calcuations
- Subscribe to RSS Feed
- Mark Topic as New
- Mark Topic as Read
- Float this Topic for Current User
- Bookmark
- Subscribe
- Mute
- Printer Friendly Page
- Mark as New
- Bookmark
- Subscribe
- Mute
- Subscribe to RSS Feed
- Permalink
- Report Inappropriate Content
Straight table calcuations
Hi all,
My data tables are below.
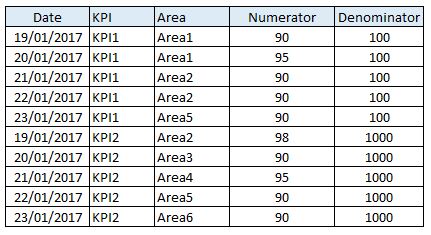
KPI Data table:
The data table has KPIs data by area for each day.
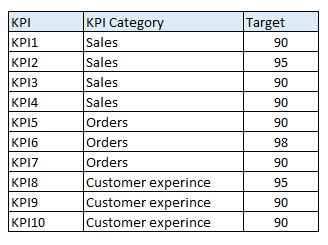
KPI Medata Data:
Metadata table contains information such has KPI name, definition, category and targets.
I am trying to create straight tables that summarizes the KPIs by monthly or quarterly, based on the user selecting the periods from the list boxes.
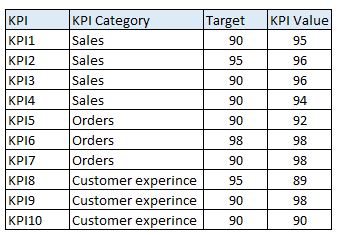
Straight tables:
I am trying to create straight tables that summarises the KPIs. I have managed to create the below without any issues. Works fine with the filters.
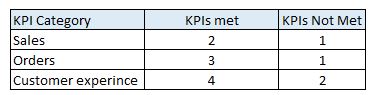
I am struck in creating the next summary table, which tells the number of KPIs met in each category. I created 2 variables (vKPI = sum(Numerator)/Denominator ; vKPImet = if(vKPI >= Target,1,0) )
And then I tried to use the variable vKPImet in the staright table, but I am not getting the desired results.
Please can you share your thoughts and help me to solve this.
- Mark as New
- Bookmark
- Subscribe
- Mute
- Subscribe to RSS Feed
- Permalink
- Report Inappropriate Content
What was the expected result. Would you provide sample to work on it same
- Mark as New
- Bookmark
- Subscribe
- Mute
- Subscribe to RSS Feed
- Permalink
- Report Inappropriate Content
Can You Tell me what is your expected output here
- Mark as New
- Bookmark
- Subscribe
- Mute
- Subscribe to RSS Feed
- Permalink
- Report Inappropriate Content
Hi,
Can you send me the sample app and expected output?
- Mark as New
- Bookmark
- Subscribe
- Mute
- Subscribe to RSS Feed
- Permalink
- Report Inappropriate Content
Hi,
There are only 3 rows for for KPI Category as (Customer Experience) but you gave the values as (KPI's Met 4 KPI's Not Met 2) so i am unable to understand what you are expecting?
please explain your expected output.
- Mark as New
- Bookmark
- Subscribe
- Mute
- Subscribe to RSS Feed
- Permalink
- Report Inappropriate Content
Hi all,
Thanks for you replies. Apologies for not providing enough details. I am trying to count the number of KPIs that met Target in each KPI category and each area. I will post the expected results shortly.
Thank you