Unlock a world of possibilities! Login now and discover the exclusive benefits awaiting you.
- Qlik Community
- :
- All Forums
- :
- QlikView App Dev
- :
- Specific and Common Filters
- Subscribe to RSS Feed
- Mark Topic as New
- Mark Topic as Read
- Float this Topic for Current User
- Bookmark
- Subscribe
- Mute
- Printer Friendly Page
- Mark as New
- Bookmark
- Subscribe
- Mute
- Subscribe to RSS Feed
- Permalink
- Report Inappropriate Content
Specific and Common Filters
Hi All,
I have 3 data tables in my Qlik app: 1. Financial dataset 2. Utilization dataset 3. HeadCount dataset
There are common fields in all 3 of my datasets, such as 'Country' and 'PC Number'. There are also fields unique to each of these tables.
I am creating various charts on my dashboard summary page. I have one for Utilization, one for Financial and one for Headcount data.
I would like to filter these by the common filters at the top. but I don't want a selection of the unique fields to affect all the filters at the top. For example, if I select something in 'Country', I want it to filter country in each of the tables. But if I select 'Department' in the Headcount dataset, I would like it to affect the 'Country' on the Headcount Dataset, but not filter the 'Country' on the 'Financial' dataset.
I have done a QUALIFY statement in the script to remove the tables associations to prevent them filtering each other.
QUESTION: But now how do I have like a central Country field that filters each of these tables.
Any workaround for this?
Would i need to create another dataset with all the common field names? Would i use alternate states instead?
i have attached a test app and welcome any suggestions. thanks!
- Mark as New
- Bookmark
- Subscribe
- Mute
- Subscribe to RSS Feed
- Permalink
- Report Inappropriate Content
One way to do this would be to create one of the three country fields as a list box and use p() function in the charts for the other two tables.
For example, I used Finance.Country as a list box and use these expressions
Sum({<Utilization.Country = p(Finance.Country)>}[Utilization.Utilization left])
Sum({<HeadCount.Country = p(Finance.Country)>}[HeadCount.Employees Number])
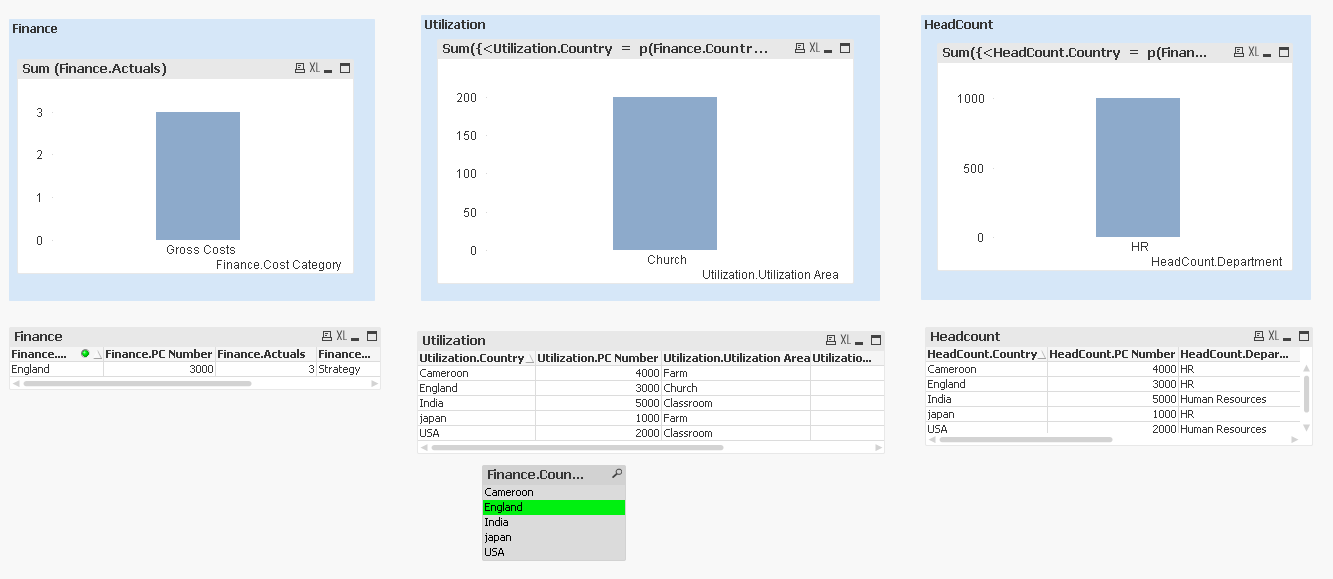
This could become a problem if you don't have all possible values in at least one table. If this is the case, I would create a fourth island table with all possible values for Country and use that as a list box and change the expression for all three charts