Unlock a world of possibilities! Login now and discover the exclusive benefits awaiting you.
- Qlik Community
- :
- All Forums
- :
- QlikView App Dev
- :
- Sparkline Trending Issue - Example QVW Included
- Subscribe to RSS Feed
- Mark Topic as New
- Mark Topic as Read
- Float this Topic for Current User
- Bookmark
- Subscribe
- Mute
- Printer Friendly Page
- Mark as New
- Bookmark
- Subscribe
- Mute
- Subscribe to RSS Feed
- Permalink
- Report Inappropriate Content
Sparkline Trending Issue - Example QVW Included
Hi All,
The expression that I'm using for sparklines is incorrectly drawing the sparkline column of the table. When the numerator and denominator of this same expression is calculated using hardcoded dates in other columns of the table, these columns are correctly calculated.
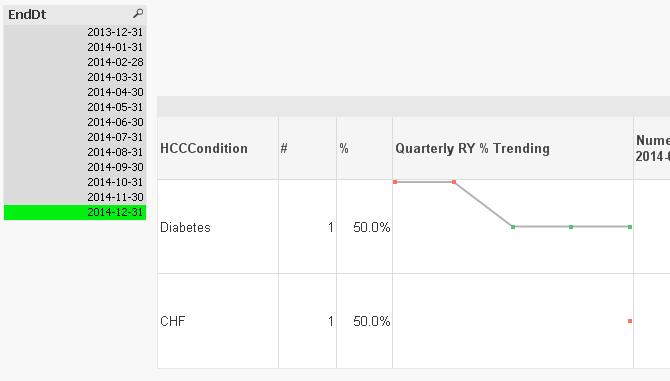
See attached example for HCC Diabetes variable - the trend line in the sparkline is incorrectly depicted as follows:

As you'll see by the data in the INLINE load of the script, the correct trendline pattern is displayed by a line chart in the application and should look like this:

Notice the data is pulled in at 2 levels so that multiple indicators can be displayed on same chart (i.e. multiple chronic conditions). This example application is simplified to only include 2 patients and 2 chronic conditions but the actual application contains many more patients and conditions.
Thanks for the help!
- « Previous Replies
-
- 1
- 2
- Next Replies »
Accepted Solutions
- Mark as New
- Bookmark
- Subscribe
- Mute
- Subscribe to RSS Feed
- Permalink
- Report Inappropriate Content
Try this
COUNT({<EndDt,QuarterEndDt-={''}>}DISTINCT KeyPatEnd)/Only({<EndDt,QuarterEndDt-={''}>}Aggr(NODISTINCT COUNT({<EndDt,QuarterEndDt-={''}>} DISTINCT KeyPatEnd), QuarterEndDt))
- Mark as New
- Bookmark
- Subscribe
- Mute
- Subscribe to RSS Feed
- Permalink
- Report Inappropriate Content
What formula did you use to generate the correct line chart?
Using your sparkline formula and dimension in a line chart generates the same output as the sparkline as expected.
- Mark as New
- Bookmark
- Subscribe
- Mute
- Subscribe to RSS Feed
- Permalink
- Report Inappropriate Content
Try this expression
COUNT({<EndDt,QuarterEndDt-={''}>}DISTINCT KeyPatEnd)/COUNT(TOTAL <QuarterEndDt> {<EndDt,QuarterEndDt-={''}>} DISTINCT KeyPatEnd)
- Mark as New
- Bookmark
- Subscribe
- Mute
- Subscribe to RSS Feed
- Permalink
- Report Inappropriate Content
What formula did you use to generate the correct line chart?
then i will able to help you
- Mark as New
- Bookmark
- Subscribe
- Mute
- Subscribe to RSS Feed
- Permalink
- Report Inappropriate Content
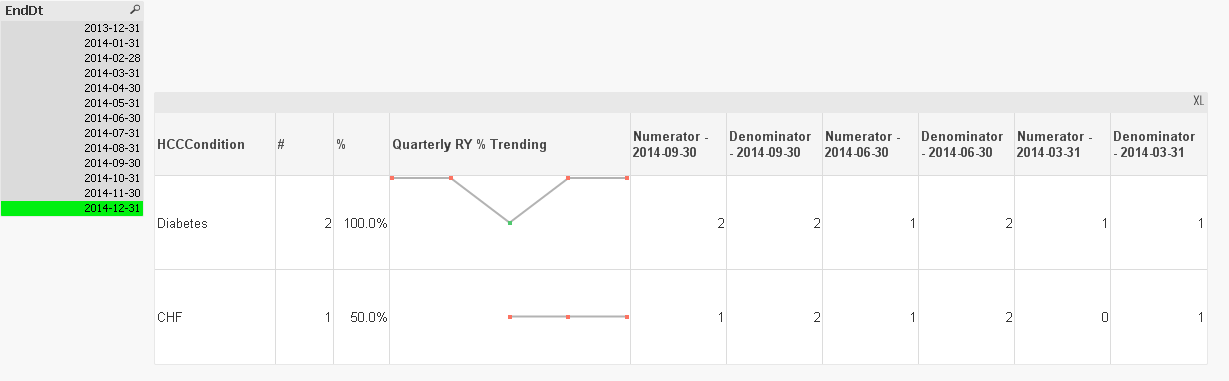
Thanks, Sunny! This worked on my dummied data above but when I tried this on my actual data, trend patterns were closer but I still noticed some differences in the charts. I put together a test_sparklines_v2 QVW with dummied data that the above code DOES NOT work on - I included additional columns to compare denominators with and without the update you sent. It appears as though this code doesn't work when one of the patients doesn't have any HCC condition (i.e. either CHF or Diabetes) in the specified time, because there is no row on HCCDim table for that KeyPatEnd. Is there any way around this? Obviously, the reason for using the separate dimension and fact tables is that I want to display all of the HCC conditions (Diabetes, CHF, plus many additional not included on dummy data) on the same charts.
Thanks!
- Mark as New
- Bookmark
- Subscribe
- Mute
- Subscribe to RSS Feed
- Permalink
- Report Inappropriate Content
The line chart and straight table use data from a different structure (i.e. different variables). Here is the code in the script, showing the two table structures (but using the data values from the new QVW I posted as a response to Sunny's feedback below)
PatientFACT:
LOAD * INLINE [
KeyPatEnd, EndDt, HCCDM, HCCCHF
A_201312, 2013-12-31, 1, 0
A_201401, 2014-01-31, 1, 0
A_201402, 2014-02-28, 1, 0
A_201403, 2014-03-31, 1, 0
A_201404, 2014-04-30, 1, 0
A_201405, 2014-05-31, 1, 0
A_201406, 2014-06-30, 1, 0
A_201407, 2014-07-31, 1, 0
A_201408, 2014-08-31, 1, 0
A_201409, 2014-09-30, 1, 0
A_201410, 2014-10-31, 1, 0
A_201411, 2014-11-30, 1, 0
A_201412, 2014-12-31, 1, 0
B_201406, 2014-06-30, 0, 0
B_201407, 2014-07-31, 0, 0
B_201408, 2014-08-31, 0, 0
B_201409, 2014-09-30, 0, 0
B_201410, 2014-10-31, 0, 0
B_201411, 2014-11-30, 0, 0
B_201412, 2014-12-31, 0, 1
];
HCCDim:
LOAD * INLINE [
KeyPatEnd, HCCCondition
A_201312, Diabetes
A_201401, Diabetes
A_201402, Diabetes
A_201403, Diabetes
A_201404, Diabetes
A_201405, Diabetes
A_201406, Diabetes
A_201407, Dibetes
A_201408, Diabetes
A_201409, Diabetes
A_201410, Diabetes
A_201411, Diabetes
A_201412, Diabetes
B_201412, CHF
];
QuarterEndDt:
LOAD * INLINE [
EndDt, QuarterEndDt
2013-12-31, 2013-12-31
2014-03-31, 2014-03-31
2014-06-30, 2014-06-30
2014-09-30, 2014-09-30
2014-12-31, 2014-12-31
];
Here is the code used for the CORRECT line chart:
COUNT(DISTINCT {<EndDt, HCCDM*={1}>} KeyPatEnd)/COUNT({<EndDt>}DISTINCT KeyPatEnd)
Notice, it is using the field from the PatientFACT table, i.e. the indicator for HCCDM. The reason why I wanted to create HCCDim separate table with one row per HCC indicators set to 1 is because I'd like to display all HCC condition indicators on the same charts (i.e. compare %s and trends for each condition).
- Mark as New
- Bookmark
- Subscribe
- Mute
- Subscribe to RSS Feed
- Permalink
- Report Inappropriate Content
The line chart and straight table use data from a different structure (i.e. different variables). Here is the code in the script, showing the two table structures (but using the data values from the new QVW I posted as a response to Sunny's feedback below)
PatientFACT:
LOAD * INLINE [
KeyPatEnd, EndDt, HCCDM, HCCCHF
A_201312, 2013-12-31, 1, 0
A_201401, 2014-01-31, 1, 0
A_201402, 2014-02-28, 1, 0
A_201403, 2014-03-31, 1, 0
A_201404, 2014-04-30, 1, 0
A_201405, 2014-05-31, 1, 0
A_201406, 2014-06-30, 1, 0
A_201407, 2014-07-31, 1, 0
A_201408, 2014-08-31, 1, 0
A_201409, 2014-09-30, 1, 0
A_201410, 2014-10-31, 1, 0
A_201411, 2014-11-30, 1, 0
A_201412, 2014-12-31, 1, 0
B_201406, 2014-06-30, 0, 0
B_201407, 2014-07-31, 0, 0
B_201408, 2014-08-31, 0, 0
B_201409, 2014-09-30, 0, 0
B_201410, 2014-10-31, 0, 0
B_201411, 2014-11-30, 0, 0
B_201412, 2014-12-31, 0, 1
];
HCCDim:
LOAD * INLINE [
KeyPatEnd, HCCCondition
A_201312, Diabetes
A_201401, Diabetes
A_201402, Diabetes
A_201403, Diabetes
A_201404, Diabetes
A_201405, Diabetes
A_201406, Diabetes
A_201407, Dibetes
A_201408, Diabetes
A_201409, Diabetes
A_201410, Diabetes
A_201411, Diabetes
A_201412, Diabetes
B_201412, CHF
];
QuarterEndDt:
LOAD * INLINE [
EndDt, QuarterEndDt
2013-12-31, 2013-12-31
2014-03-31, 2014-03-31
2014-06-30, 2014-06-30
2014-09-30, 2014-09-30
2014-12-31, 2014-12-31
];
Here is the code used for the CORRECT line chart:
COUNT(DISTINCT {<EndDt, HCCDM*={1}>} KeyPatEnd)/COUNT({<EndDt>}DISTINCT KeyPatEnd)
Notice, it is using the field from the PatientFACT table, i.e. the indicator for HCCDM. The reason why I wanted to create HCCDim separate table with one row per HCC indicators set to 1 is because I'd like to display all HCC condition indicators on the same charts (i.e. compare %s and trends for each condition). This is why I need to use HCCDim instead of PatientFACT for the sparkline straight table which contains all conditions.
- Mark as New
- Bookmark
- Subscribe
- Mute
- Subscribe to RSS Feed
- Permalink
- Report Inappropriate Content
Try this
COUNT({<EndDt,QuarterEndDt-={''}>}DISTINCT KeyPatEnd)/Only({<EndDt,QuarterEndDt-={''}>}Aggr(NODISTINCT COUNT({<EndDt,QuarterEndDt-={''}>} DISTINCT KeyPatEnd), QuarterEndDt))
- Mark as New
- Bookmark
- Subscribe
- Mute
- Subscribe to RSS Feed
- Permalink
- Report Inappropriate Content
This looks really good. I'll validate and then mark as correct! Do you also know whether I'll need to update my code to calculate in columns the Minimum Quarterly Rolling Year, Minimum Quarterly RY Date, Maximum Quarterly RY, and Maximum Quarterly RY Date? You helped with these in a separate post but now that I have updated sparkline code, I'd like to create the same columns that display the minimum % highlighted in the sparkline, the associated date, and the maximum % highlighted in the sparkline, and the associated date?
I was using this code before made the change to sparkline code:
Minimum Quarterly RY:
Min({<EndDt,QuarterEndDt-={''}>}Aggr(COUNT({<EndDt,QuarterEndDt-={''}>} DISTINCT KeyPatEnd)/COUNT(TOTAL <QuarterEndDt>{<EndDt,QuarterEndDt-={''}>}DISTINCT KeyPatEnd), QuarterEndDt,"$(vDimensionConditionTrends)"))
Minimum Quarterly RY Date:
FirstSortedValue({<EndDt,QuarterEndDt-={''}>} QuarterEndDt, Aggr(COUNT({<EndDt,QuarterEndDt-={''}>} DISTINCT KeyPatEnd)/COUNT(TOTAL <QuarterEndDt>{<EndDt,QuarterEndDt-={''}>}DISTINCT KeyPatEnd), "$(vDimensionConditionTrends)",QuarterEndDt))
Maximum Quarterly RY:
Max({<EndDt,QuarterEndDt-={''}>}Aggr(COUNT({<EndDt,QuarterEndDt-={''}>} DISTINCT KeyPatEnd)/COUNT(TOTAL <QuarterEndDt>{<EndDt,QuarterEndDt-={''}>}DISTINCT KeyPatEnd), "$(vDimensionConditionTrends)",QuarterEndDt))
Maximum Quarterly RY Date:
FirstSortedValue({<EndDt,QuarterEndDt-={''}>} QuarterEndDt, -Aggr(COUNT({<EndDt,QuarterEndDt-={''}>} DISTINCT KeyPatEnd)/COUNT(TOTAL <QuarterEndDt>{<EndDt,QuarterEndDt-={''}>}DISTINCT KeyPatEnd), "$(vDimensionConditionTrends)",QuarterEndDt))
Thank you so much! Will validate and mark as correct!
- Mark as New
- Bookmark
- Subscribe
- Mute
- Subscribe to RSS Feed
- Permalink
- Report Inappropriate Content
May be try this
Minimum Quarterly RY Date:
FirstSortedValue({<EndDt,QuarterEndDt-={''}>} QuarterEndDt, Aggr(COUNT({<EndDt,QuarterEndDt-={''}>} DISTINCT KeyPatEnd)/Only({<EndDt,QuarterEndDt-={''}>}Aggr(NODISTINCT COUNT({<EndDt,QuarterEndDt-={''}>} DISTINCT KeyPatEnd), QuarterEndDt)), "$(vDimensionConditionTrends)",QuarterEndDt))
So essentially replace this
COUNT(TOTAL <QuarterEndDt>{<EndDt,QuarterEndDt-={''}>}DISTINCT KeyPatEnd)
with this
Only({<EndDt,QuarterEndDt-={''}>}Aggr(NODISTINCT COUNT({<EndDt,QuarterEndDt-={''}>} DISTINCT KeyPatEnd), QuarterEndDt))
in all your expressions
- « Previous Replies
-
- 1
- 2
- Next Replies »