Unlock a world of possibilities! Login now and discover the exclusive benefits awaiting you.
- Qlik Community
- :
- All Forums
- :
- QlikView App Dev
- :
- Sort the X axis
- Subscribe to RSS Feed
- Mark Topic as New
- Mark Topic as Read
- Float this Topic for Current User
- Bookmark
- Subscribe
- Mute
- Printer Friendly Page
- Mark as New
- Bookmark
- Subscribe
- Mute
- Subscribe to RSS Feed
- Permalink
- Report Inappropriate Content
Sort the X axis
Hey all,
I have a bubble chart currently created:
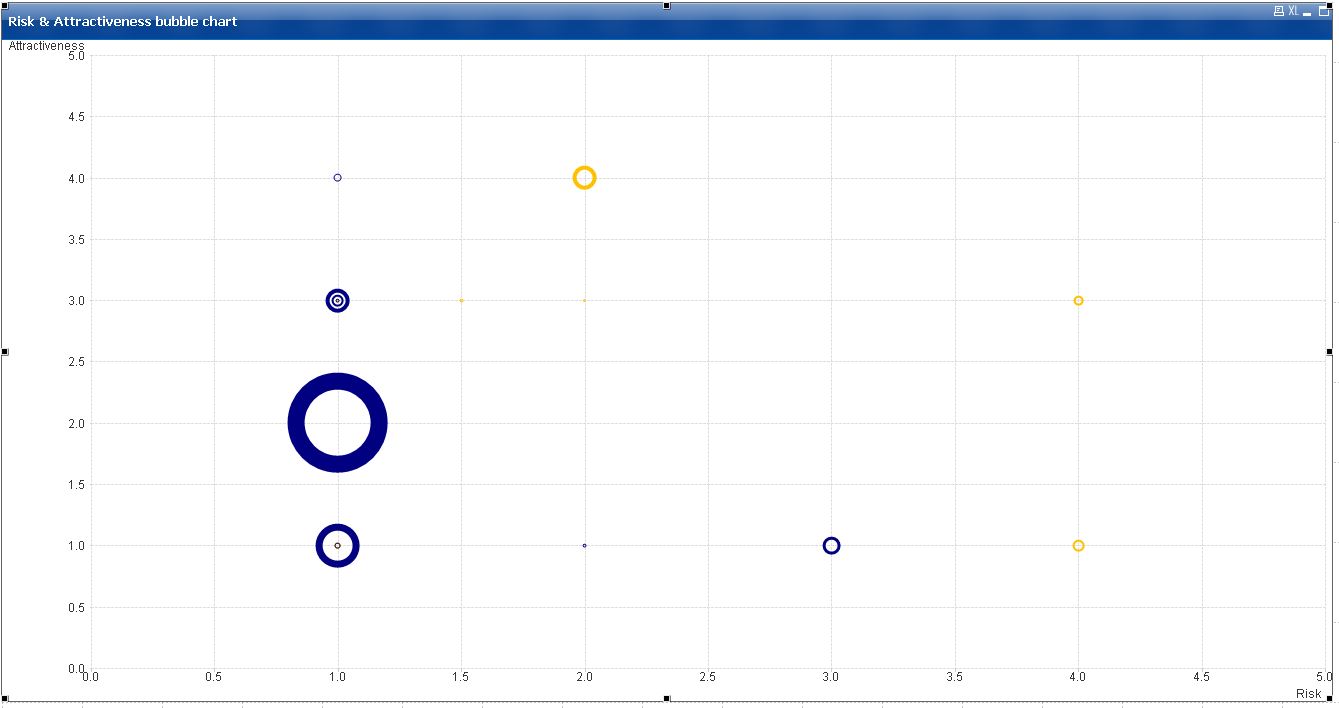
I would like to inverse the value of my risk axis (x-axis) so they start at 5 and finish at 0.
I have no possibility to define the sort for the X-axis.
Any idea?
Accepted Solutions
- Mark as New
- Bookmark
- Subscribe
- Mute
- Subscribe to RSS Feed
- Permalink
- Report Inappropriate Content
Hi, Arnaud!
You may do this little more simplier than Sunny offer.
Go to the Axes tab and remove the check from "Forced to 0" in "X Axis" zone.
Next set a Static Min = 5, Static Max = 0. Your axis will be inversed. See the picture below:
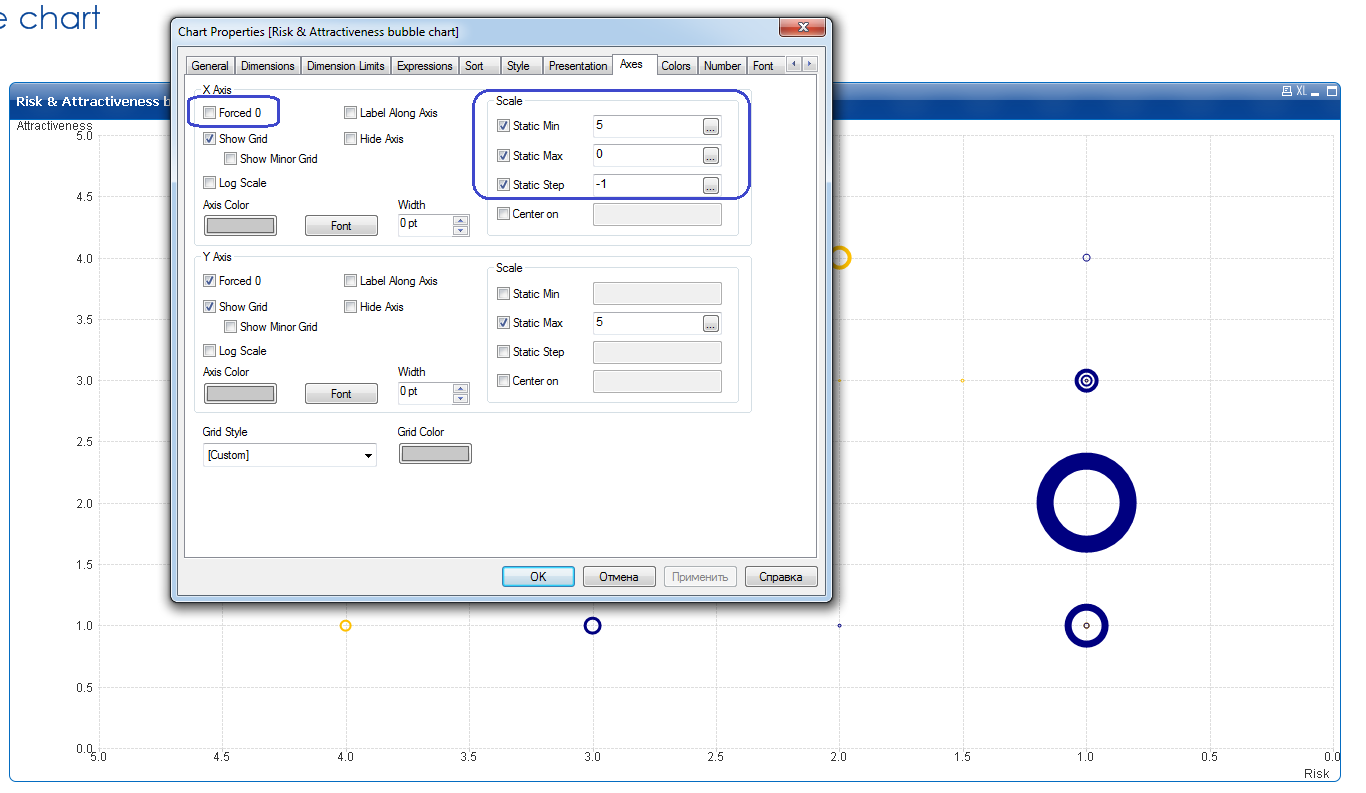
P.S.: I've also entered the Static Step equal minus one - there is no need of it.
- Mark as New
- Bookmark
- Subscribe
- Mute
- Subscribe to RSS Feed
- Permalink
- Report Inappropriate Content
Would you be able to share a sample to try it out?
- Mark as New
- Bookmark
- Subscribe
- Mute
- Subscribe to RSS Feed
- Permalink
- Report Inappropriate Content
Here in attachment
- Mark as New
- Bookmark
- Subscribe
- Mute
- Subscribe to RSS Feed
- Permalink
- Report Inappropriate Content
See if this approach works for you
- Mark as New
- Bookmark
- Subscribe
- Mute
- Subscribe to RSS Feed
- Permalink
- Report Inappropriate Content
Hey Sunny,
It's look great.
Can you describe me what you did?
Thank you in advance
- Mark as New
- Bookmark
- Subscribe
- Mute
- Subscribe to RSS Feed
- Permalink
- Report Inappropriate Content
Expression
Dual(
Max ({<SnapShotCalendar.Year={'$(SelectedCalendarYear)'}, SnapShotCalendar.MonthNum={'$(SelectedCalendarMonthNum)'},Stage={'Nego', 'Proposal'}>}[Opportunities.RiskAssessment]),
-Max ({<SnapShotCalendar.Year={'$(SelectedCalendarYear)'}, SnapShotCalendar.MonthNum={'$(SelectedCalendarMonthNum)'},Stage={'Nego', 'Proposal'}>}[Opportunities.RiskAssessment]))
Instead of using positive values, I converted them into negative value, but used dual function to show positive values on the axis. To show positive values on the axis, I had to do this Currency and Other Symbols on the Y-Axis | Qlikview Cookbook
- Mark as New
- Bookmark
- Subscribe
- Mute
- Subscribe to RSS Feed
- Permalink
- Report Inappropriate Content
Hi, Arnaud!
You may do this little more simplier than Sunny offer.
Go to the Axes tab and remove the check from "Forced to 0" in "X Axis" zone.
Next set a Static Min = 5, Static Max = 0. Your axis will be inversed. See the picture below:
P.S.: I've also entered the Static Step equal minus one - there is no need of it.
- Mark as New
- Bookmark
- Subscribe
- Mute
- Subscribe to RSS Feed
- Permalink
- Report Inappropriate Content
Hey Sergey,
It works perfectly !
Thank you very much.