Unlock a world of possibilities! Login now and discover the exclusive benefits awaiting you.
- Qlik Community
- :
- All Forums
- :
- QlikView App Dev
- :
- Slice in Pie chart
- Subscribe to RSS Feed
- Mark Topic as New
- Mark Topic as Read
- Float this Topic for Current User
- Bookmark
- Subscribe
- Mute
- Printer Friendly Page
- Mark as New
- Bookmark
- Subscribe
- Mute
- Subscribe to RSS Feed
- Permalink
- Report Inappropriate Content
Slice in Pie chart
Hi Community,
I have one pie chart.. by default showing two slices...
My expression Count(Employee)
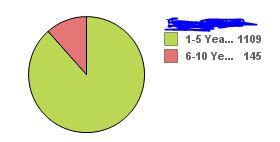
i have bucket, 1-5 years, 6-10 years
I have written Count({<Bucket={'1-5 Years'}>}Employee), but it showing 100% pie chart.
I want to show only 1-5 years slice Pink color slice.
Thanks in Advance...
- « Previous Replies
-
- 1
- 2
- Next Replies »
- Mark as New
- Bookmark
- Subscribe
- Mute
- Subscribe to RSS Feed
- Permalink
- Report Inappropriate Content
try this
Count({<Bucket={'1-5 Years'}>}Employee)
- Mark as New
- Bookmark
- Subscribe
- Mute
- Subscribe to RSS Feed
- Permalink
- Report Inappropriate Content
- Mark as New
- Bookmark
- Subscribe
- Mute
- Subscribe to RSS Feed
- Permalink
- Report Inappropriate Content
Sorry i written
Count({<Bucket={'1-5 Years'}>}Employee) Only..
But it's not working.... If i am write this it showing 100% pie chart..
I din't want to show 100%, i want show only piece of bucket (1-5 Years Percentage only)
- Mark as New
- Bookmark
- Subscribe
- Mute
- Subscribe to RSS Feed
- Permalink
- Report Inappropriate Content
try this
Count({<Bucket-={'1-5 Years'}>}Employee)
- Mark as New
- Bookmark
- Subscribe
- Mute
- Subscribe to RSS Feed
- Permalink
- Report Inappropriate Content
Hi,
TRY IT
Count({<Bucket -={''1-5 Years''}>}Employee)
- Mark as New
- Bookmark
- Subscribe
- Mute
- Subscribe to RSS Feed
- Permalink
- Report Inappropriate Content
what is the error ur getting?
can u share sample for this?
- Mark as New
- Bookmark
- Subscribe
- Mute
- Subscribe to RSS Feed
- Permalink
- Report Inappropriate Content
What is the dimension your using ???
Try like this
1.un-check the show in % in the expression
2.create a variable vSum = count({1}Employee)
3. add this expression
Count({<Bucket={'1-5 Years'}Employee>})/vSum
then go to numbers tab select the expression and check on numbers + show in %
hope this helps you
- Mark as New
- Bookmark
- Subscribe
- Mute
- Subscribe to RSS Feed
- Permalink
- Report Inappropriate Content
Paul ,
try like this
Try like this
1.un-check the show in % in the expression
2.create a variable vSum = count({1}Employee)
3. add this expression
Count({<Bucket={'1-5 Years'}Employee>})/vSum
then go to numbers tab select the expression and check on numbers + show in %
- Mark as New
- Bookmark
- Subscribe
- Mute
- Subscribe to RSS Feed
- Permalink
- Report Inappropriate Content
Dimension: Bucket
Expression: Count(Employees)
Background color Expression: if( Bucket ='1-5 Years', RGB(210,211,30),white())
- « Previous Replies
-
- 1
- 2
- Next Replies »