Unlock a world of possibilities! Login now and discover the exclusive benefits awaiting you.
- Qlik Community
- :
- All Forums
- :
- QlikView App Dev
- :
- Show Latest Month Data
- Subscribe to RSS Feed
- Mark Topic as New
- Mark Topic as Read
- Float this Topic for Current User
- Bookmark
- Subscribe
- Mute
- Printer Friendly Page
- Mark as New
- Bookmark
- Subscribe
- Mute
- Subscribe to RSS Feed
- Permalink
- Report Inappropriate Content
Show Latest Month Data
Hi There
I have below requirement, where I want to show latest month data from given set of data, From below example I want to show only May Data in the graph / Table by default without selecting any parameters on the QV application.
| Date | Project | Associate |
| 1/1/2015 | ABC | 1 |
| 1/2/2015 | ABC | 2 |
| 1/3/2015 | ABC | 3 |
| 1/4/2015 | ABC | 4 |
| 1/5/2015 | ABC | 5 |
| 1/6/2015 | ABC | 6 |
| 1/7/2015 | XYZ | 7 |
| 1/8/2015 | XYZ | 8 |
| 1/9/2015 | XYZ | 9 |
| 1/10/2015 | XYZ | 10 |
| 1/11/2015 | XYZ | 11 |
| 1/12/2015 | XYZ | 12 |
| 2/1/2015 | ABC | 1 |
| 2/2/2015 | ABC | 2 |
| 2/3/2015 | ABC | 3 |
| 2/4/2015 | ABC | 4 |
| 2/5/2015 | ABC | 5 |
| 2/6/2015 | ABC | 6 |
| 2/7/2015 | XYZ | 7 |
| 2/8/2015 | XYZ | 8 |
| 2/9/2015 | XYZ | 9 |
| 2/10/2015 | XYZ | 10 |
| 2/11/2015 | XYZ | 11 |
| 2/12/2015 | XYZ | 12 |
| 5/1/2015 | ABC | 1 |
| 5/2/2015 | ABC | 2 |
| 5/3/2015 | ABC | 3 |
| 5/4/2015 | ABC | 4 |
| 5/5/2015 | ABC | 5 |
| 5/7/2015 | XYZ | 7 |
| 5/8/2015 | XYZ | 8 |
| 5/10/2015 | XYZ | 10 |
| 5/11/2015 | XYZ | 11 |
Thanks in advance.
- Tags:
- new_to_qlikview
- « Previous Replies
-
- 1
- 2
- Next Replies »
- Mark as New
- Bookmark
- Subscribe
- Mute
- Subscribe to RSS Feed
- Permalink
- Report Inappropriate Content
Is this what you want?
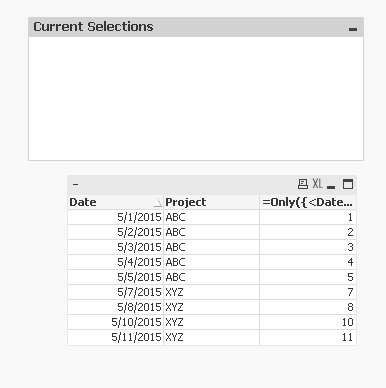
Script:
Table:
LOAD Date,
Project,
Associate
FROM
[https://community.qlik.com/thread/169856]
(html, codepage is 1252, embedded labels, table is @1);
Dimension: Date, Project
Expression: =Only({<Date = {"$(='>=' & Date(AddMonths(Max(Date),-1)))"}>}Associate)
Best,
Sunny
- Mark as New
- Bookmark
- Subscribe
- Mute
- Subscribe to RSS Feed
- Permalink
- Report Inappropriate Content
Use Calculated Dimension in your Application..
=Date(IF(Date>=MonthStart(Today()) and Date<=MonthEnd(Today()), Date))
- Mark as New
- Bookmark
- Subscribe
- Mute
- Subscribe to RSS Feed
- Permalink
- Report Inappropriate Content
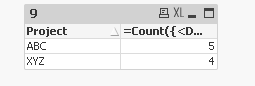
Thanks
I want to count Number of associates for the months / project.
- Mark as New
- Bookmark
- Subscribe
- Mute
- Subscribe to RSS Feed
- Permalink
- Report Inappropriate Content
I want to show this information on Graph.
- Mark as New
- Bookmark
- Subscribe
- Mute
- Subscribe to RSS Feed
- Permalink
- Report Inappropriate Content
Dimension
=Date(IF(Date>=MonthStart(Today()) and Date<=MonthEnd(Today()), Date))
Project
Expression
COUNT(Distinct Associate)
or
COUNT(Associate)
- Mark as New
- Bookmark
- Subscribe
- Mute
- Subscribe to RSS Feed
- Permalink
- Report Inappropriate Content
This?
- Mark as New
- Bookmark
- Subscribe
- Mute
- Subscribe to RSS Feed
- Permalink
- Report Inappropriate Content
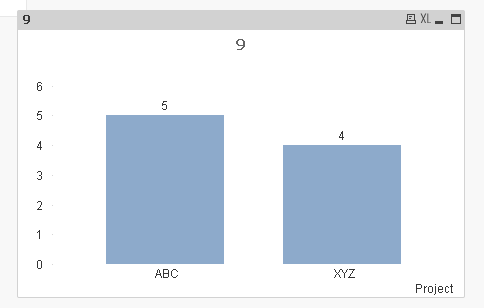
Yes, this kind of output on graph.
- Mark as New
- Bookmark
- Subscribe
- Mute
- Subscribe to RSS Feed
- Permalink
- Report Inappropriate Content
Convert it into a bar graph or line chart according to your need !:
- Mark as New
- Bookmark
- Subscribe
- Mute
- Subscribe to RSS Feed
- Permalink
- Report Inappropriate Content
Thanks , this is exactly what I am looking for. Can you please send me QV file?
- « Previous Replies
-
- 1
- 2
- Next Replies »