Unlock a world of possibilities! Login now and discover the exclusive benefits awaiting you.
- Qlik Community
- :
- All Forums
- :
- QlikView App Dev
- :
- Set analysis issue
- Subscribe to RSS Feed
- Mark Topic as New
- Mark Topic as Read
- Float this Topic for Current User
- Bookmark
- Subscribe
- Mute
- Printer Friendly Page
- Mark as New
- Bookmark
- Subscribe
- Mute
- Subscribe to RSS Feed
- Permalink
- Report Inappropriate Content
Set analysis issue
Hello,
I need to find away to get around these less than signs (<=30 and <=60) in my set analysis, because QV should not see them as a statement but as text.
Can someone help me?
My set analysis:
sum({$<VervallenSegmStatus -= {'<=30', '<=60'}>} _Saldo)
Thanks for your help!
Jasper
Accepted Solutions
- Mark as New
- Bookmark
- Subscribe
- Mute
- Subscribe to RSS Feed
- Permalink
- Report Inappropriate Content
- Mark as New
- Bookmark
- Subscribe
- Mute
- Subscribe to RSS Feed
- Permalink
- Report Inappropriate Content
Perhaps this
sum({$<VervallenSegmStatus -= {"<=30 <=60"}>} _Saldo)
OR
sum({$<VervallenSegmStatus -= {<=30 <=60}>} _Saldo)
OR
If you don't want to show in b/w of 30 and 60 you should write like below
sum({$<VervallenSegmStatus -= {">=30 <=60"}>} _Saldo)
- Mark as New
- Bookmark
- Subscribe
- Mute
- Subscribe to RSS Feed
- Permalink
- Report Inappropriate Content
addition to that
sum({$<VervallenSegmStatus -= {'<=30' and ' <=60'}>} _Saldo)
- Mark as New
- Bookmark
- Subscribe
- Mute
- Subscribe to RSS Feed
- Permalink
- Report Inappropriate Content
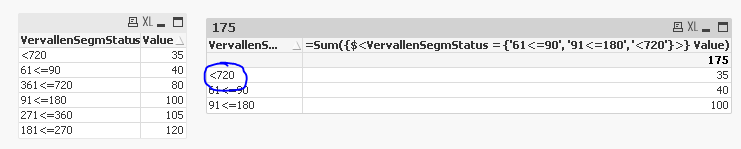
I have made a new example to show my problem in another way.
This set analysis works but it does not show '<720', these are all labels so the less than sign should not be seen as a statement but as a text. The other labels are shown, only '<720' not!
=sum({$<VervallenSegmStatus = {'61<=90', '91<=180', '181<=270', '271<=360', '361<=720', '<720'}>} TOTAL <Klant> _Saldo)
- Mark as New
- Bookmark
- Subscribe
- Mute
- Subscribe to RSS Feed
- Permalink
- Report Inappropriate Content
The <=30 is already covered by the <=60, so can be discarded.
sum({$<VervallenSegmStatus -= {"<=60"}>} _Saldo)
If you mean >=30, then
sum({$<VervallenSegmStatus -= {">=30 <=60"}>} _Saldo)
- Mark as New
- Bookmark
- Subscribe
- Mute
- Subscribe to RSS Feed
- Permalink
- Report Inappropriate Content
Hi,
Could be something you could do in script.
Something like
Load,
ID,
IF(Sum(VervallenSegmStatus) >= 30 and Sum(VervallenSegmStatus) <= 60, 1,0) AS Flag
Resident Table
groupby ID;
Then the set analysis Sum({<Flag=1>}_Saldo)
Mark
- Mark as New
- Bookmark
- Subscribe
- Mute
- Subscribe to RSS Feed
- Permalink
- Report Inappropriate Content
I am unable to replicate the issue you are facing
- Mark as New
- Bookmark
- Subscribe
- Mute
- Subscribe to RSS Feed
- Permalink
- Report Inappropriate Content
Thanks to looking at your example, i noticed that the set analysis worked but the problem was due to a bad dimension.
Thanks for your help!
- Mark as New
- Bookmark
- Subscribe
- Mute
- Subscribe to RSS Feed
- Permalink
- Report Inappropriate Content
Super 