Unlock a world of possibilities! Login now and discover the exclusive benefits awaiting you.
- Qlik Community
- :
- All Forums
- :
- QlikView App Dev
- :
- Scripting
- Subscribe to RSS Feed
- Mark Topic as New
- Mark Topic as Read
- Float this Topic for Current User
- Bookmark
- Subscribe
- Mute
- Printer Friendly Page
- Mark as New
- Bookmark
- Subscribe
- Mute
- Subscribe to RSS Feed
- Permalink
- Report Inappropriate Content
Scripting
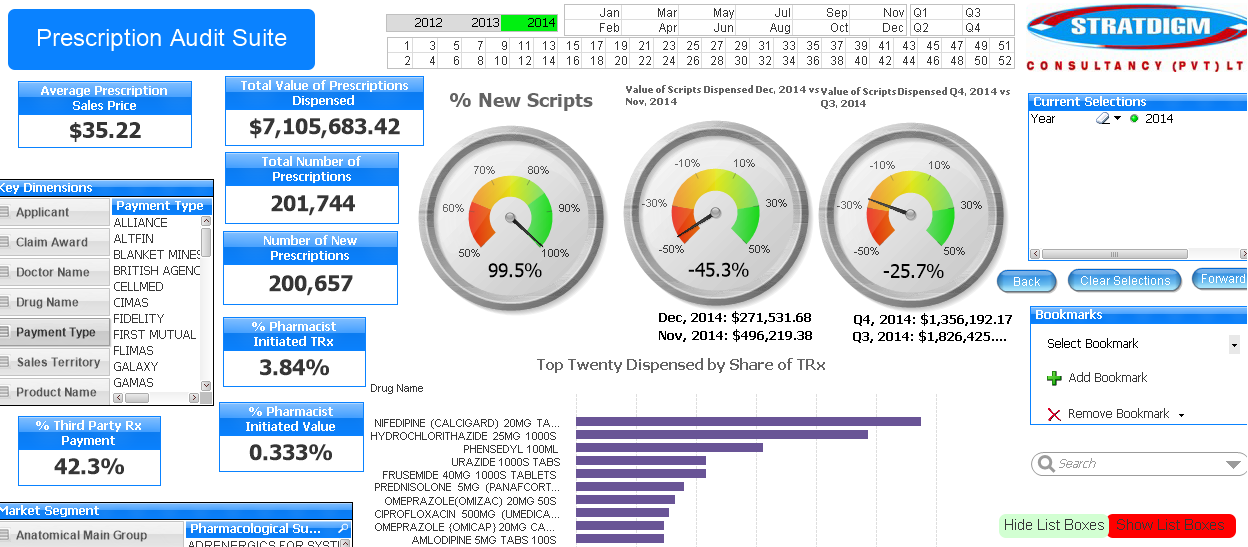
I am calculating average prescription sales value which is the total value of prescriptions dispensed divided by the total number of prescriptions dispensed. I have year, month, quarter and day filters. The results for the year 2104 filter are displayed below:
The results of the year 2014 and June filter are shown below.
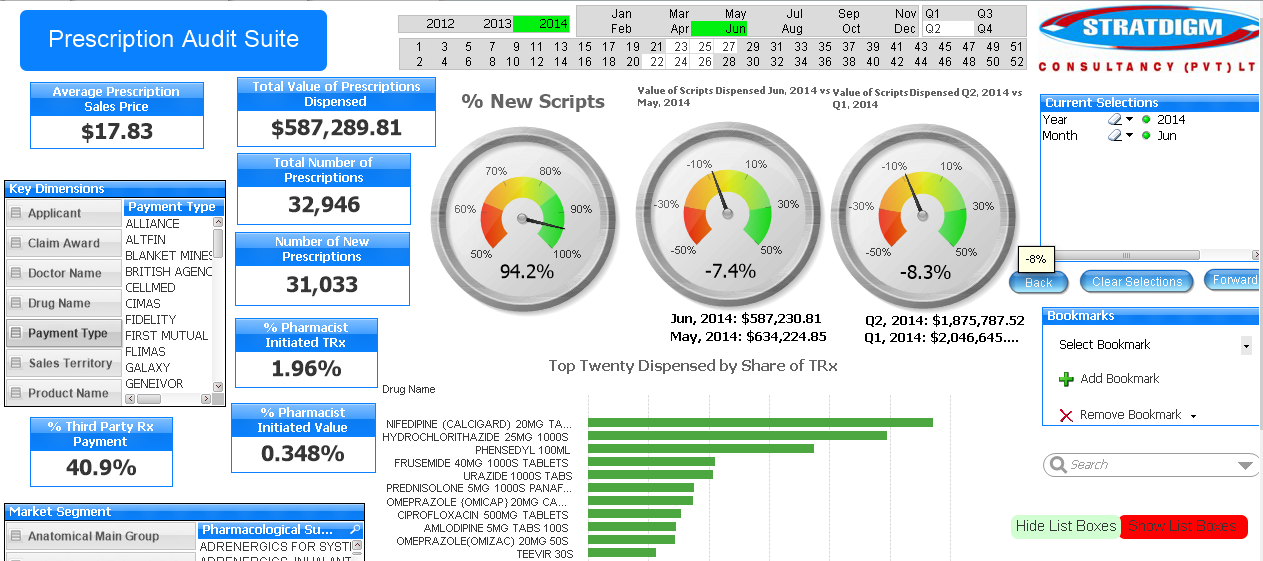
If i change the month filter for the whole year, the average prescription sales values ranges from $17 to $21. Why is this well below the annual figure of $35. What could be going wrong?
Thank you in advance
- Tags:
- scripting
- Mark as New
- Bookmark
- Subscribe
- Mute
- Subscribe to RSS Feed
- Permalink
- Report Inappropriate Content
I don't think anything is going wrong here.
When you apply month filter, it will only show the figures of selected month,.
Hence sales value for Jun are well below year sales value.
- Mark as New
- Bookmark
- Subscribe
- Mute
- Subscribe to RSS Feed
- Permalink
- Report Inappropriate Content
Hi Christopher, just guessing but maybe you are using distinct to count Number of Prescriptions and the same prescription is in differents months?
I'll do a table to show value of prescriptions and number of prescriptions by month and check what metric has different values doing a sum of each month than the year total. And also in this table you can check all prescriptions are assigned to a month.
- Mark as New
- Bookmark
- Subscribe
- Mute
- Subscribe to RSS Feed
- Permalink
- Report Inappropriate Content
Many thanks Ruben, yes i am using distinct to count Number of Prescriptions as a single prescriptions will have a number of products assigned with the same prescription number. the same prescription should not be in different months as this is a unique record. What could be going on?
I will try your suggestion.
- Mark as New
- Bookmark
- Subscribe
- Mute
- Subscribe to RSS Feed
- Permalink
- Report Inappropriate Content
Many thanks Abhijit
- Mark as New
- Bookmark
- Subscribe
- Mute
- Subscribe to RSS Feed
- Permalink
- Report Inappropriate Content
Hi Ruben
Removing the DISTINCT gives consistent figures
thanks