Unlock a world of possibilities! Login now and discover the exclusive benefits awaiting you.
- Qlik Community
- :
- All Forums
- :
- QlikView App Dev
- :
- Scatter Plot - Chart not Displayed - Undefined Val...
Options
- Subscribe to RSS Feed
- Mark Topic as New
- Mark Topic as Read
- Float this Topic for Current User
- Bookmark
- Subscribe
- Mute
- Printer Friendly Page
Turn on suggestions
Auto-suggest helps you quickly narrow down your search results by suggesting possible matches as you type.
Showing results for
Partner - Creator
2018-05-04
01:12 PM
- Mark as New
- Bookmark
- Subscribe
- Mute
- Subscribe to RSS Feed
- Permalink
- Report Inappropriate Content
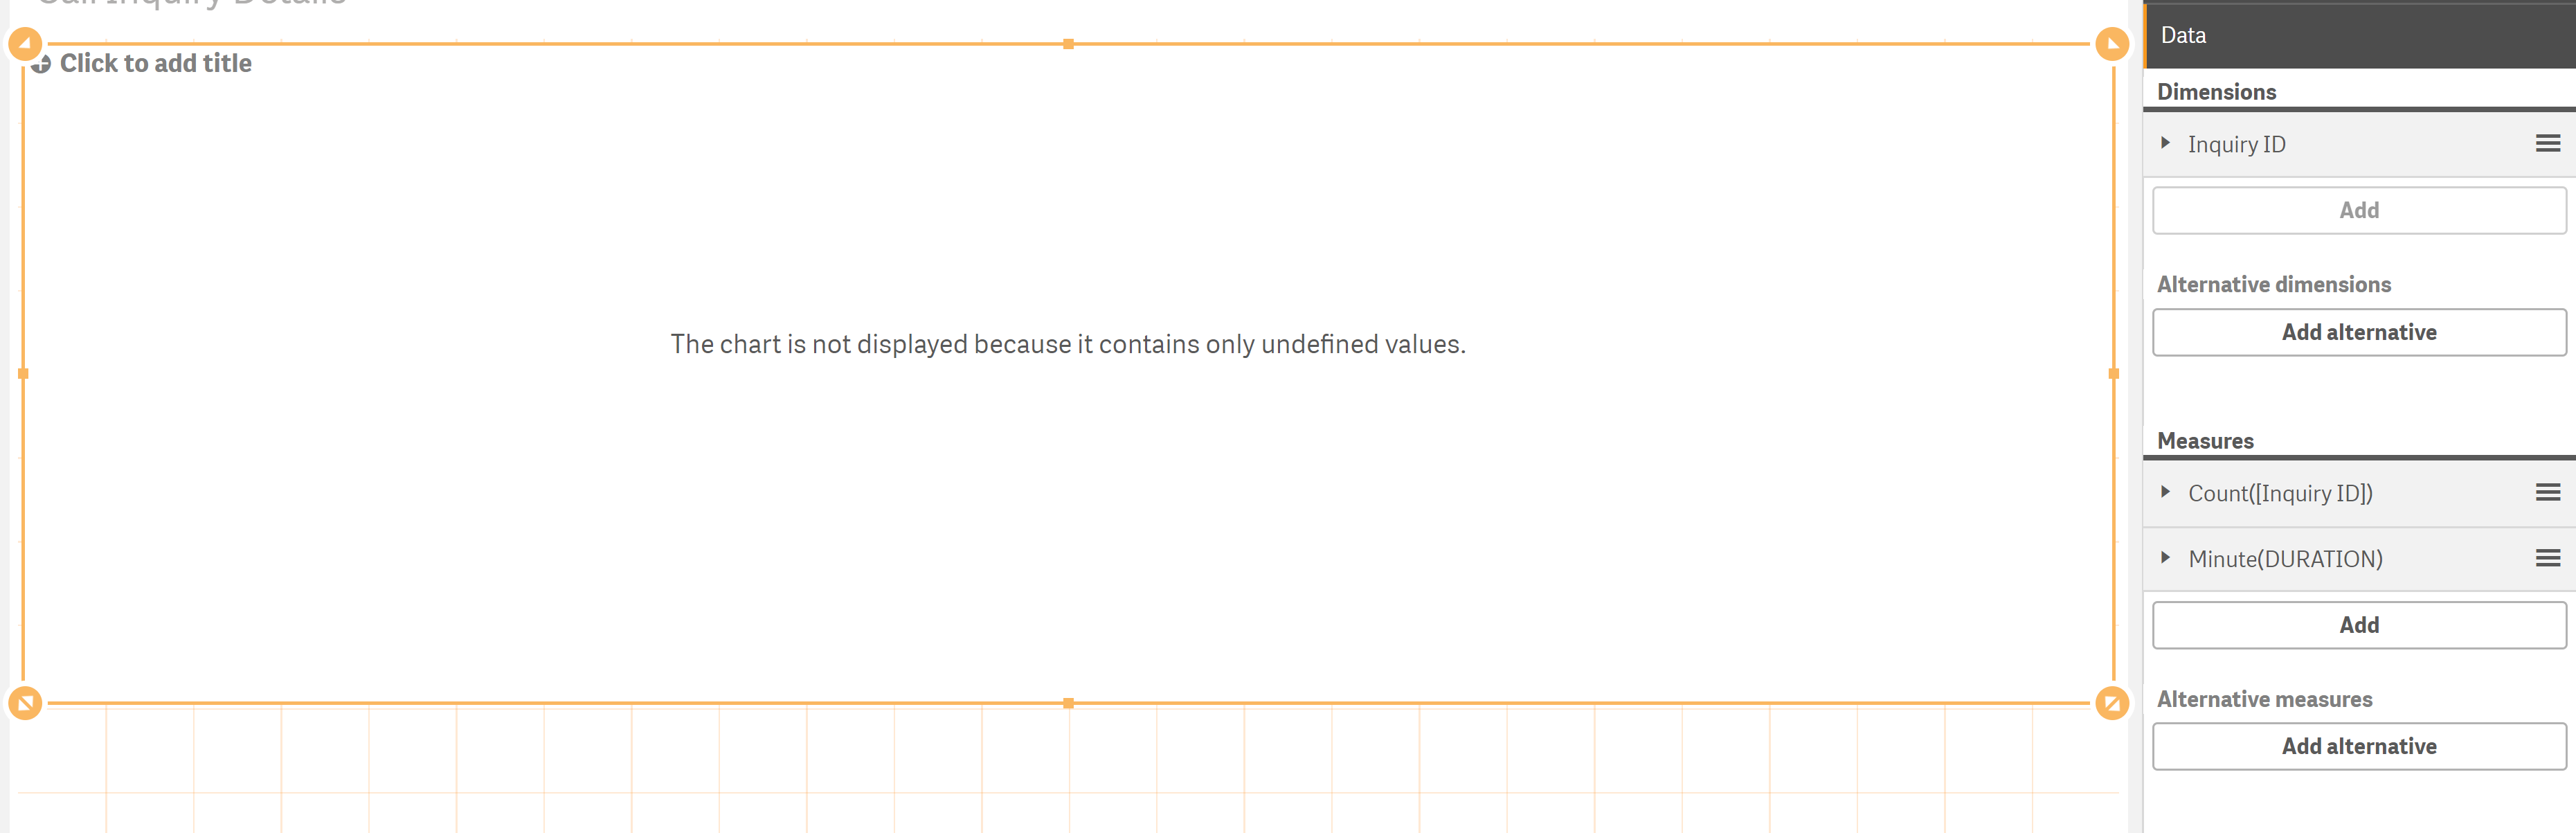
Scatter Plot - Chart not Displayed - Undefined Values
Hi,
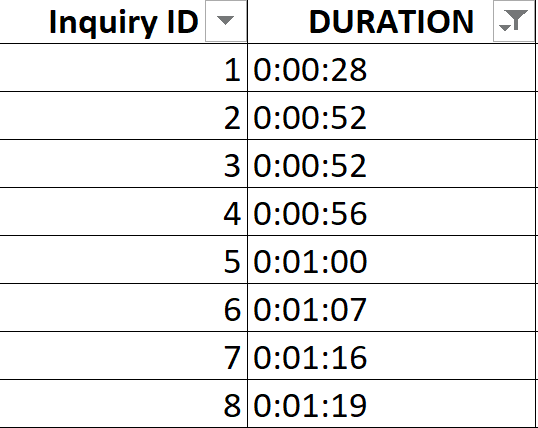
I need help with a scatter plot that I'm creating. I'm receiving the message "The chart is not displayed because it contains only undefined values." I'm not sure what I'm doing wrong. Here is a screenshot of the dimension and measures that I'm using. Dimension and measures are being pulled from two columns of a spreadsheet - see second screenshot.
Thank you!
1,848 Views
1 Reply
Specialist III
2018-05-04
05:41 PM
- Mark as New
- Bookmark
- Subscribe
- Mute
- Subscribe to RSS Feed
- Permalink
- Report Inappropriate Content
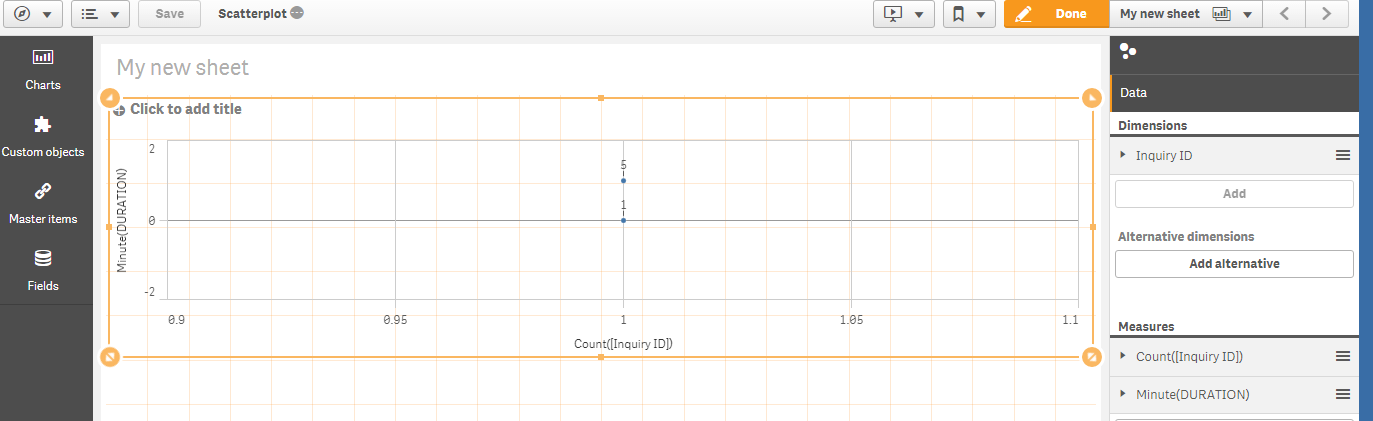
I tried to replicate your chart and it works. I would put your data in a straight table to ensure the values are what you expect.
1,614 Views