Unlock a world of possibilities! Login now and discover the exclusive benefits awaiting you.
- Qlik Community
- :
- All Forums
- :
- QlikView App Dev
- :
- Sales percentage in ranges by product
- Subscribe to RSS Feed
- Mark Topic as New
- Mark Topic as Read
- Float this Topic for Current User
- Bookmark
- Subscribe
- Mute
- Printer Friendly Page
- Mark as New
- Bookmark
- Subscribe
- Mute
- Subscribe to RSS Feed
- Permalink
- Report Inappropriate Content
Sales percentage in ranges by product
Hello
I need to create a table that show the follow:
| Product | < 20% | 20% - 50% | 51% - 80% | > 90% |
|---|---|---|---|---|
| Product A | 8 | 25 | 80 | 20 |
| Product B | 30 | 70 | 15 | 2 |
| Product C | 55 | 15 | 15 | 7 |
| Others | 45 | 100 | 25 | 15 |
In 8 stores the Product A represent less than 20% of the total sales
In 70 stores the Product B represent between 20 and 50 percent of the total sales
In 7 stores the Product C represent more than 90 percent of the sales
etc.
In the Database I have a Fact Table with the detailed transacctions, the fact table is like this:
| Date | Store | Product | Transacction ID | Amount |
|---|---|---|---|---|
| 15/06/2015 | Store 1 | Product A | 00000001 | $ 10.75 |
| 10/04/2015 | Store 3 | Product B | 00000002 | $ 28.35 |
| 14/03/2015 | Store 2 | Product A | 00000003 | $ 50.38 |
| 10/04/2015 | Store 1 | Product C | 00000004 | $ 45.22 |
Someone know how can I elaborate this kind of anlaysis
Best Regards
- Tags:
- dimensions:
- ranges
- « Previous Replies
-
- 1
- 2
- Next Replies »
- Mark as New
- Bookmark
- Subscribe
- Mute
- Subscribe to RSS Feed
- Permalink
- Report Inappropriate Content
Can you post a Qlikview document that demonstrates the problem?
talk is cheap, supply exceeds demand
- Mark as New
- Bookmark
- Subscribe
- Mute
- Subscribe to RSS Feed
- Permalink
- Report Inappropriate Content
I don't have the document already, I only have the fact table and the dimnensions
I'm tring at this point to bulid the analysis
- Mark as New
- Bookmark
- Subscribe
- Mute
- Subscribe to RSS Feed
- Permalink
- Report Inappropriate Content
I am not sure if my approach gives you a starting point. However, here is my approach:
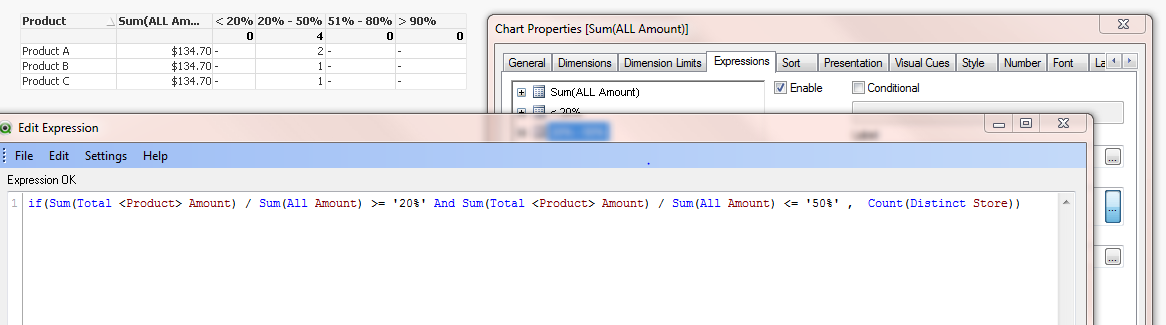
For each percentage bucket, I created different expressions and I just labeled columns based on the percentage brackets. If an expression falls into a percentage bucket, then I counted the distinct number of stores.
Hope this helps.
- Mark as New
- Bookmark
- Subscribe
- Mute
- Subscribe to RSS Feed
- Permalink
- Report Inappropriate Content
Sorry I made wrong my question:
All is based in the transacctions
Let say The Store A make 200 transacctions: 10 of Product A, 140 of Product B and 50 of Product C. This store make lees than 20% of transacctions of the Product A.
My analysis need to tell me how many of this stores I have (Stores that sells less than 20% of transacctions of certain product and the same for the others ranges.
Is this a Little bit clear??
- Mark as New
- Bookmark
- Subscribe
- Mute
- Subscribe to RSS Feed
- Permalink
- Report Inappropriate Content
Well, in this case we can change the function to count transaction IDs. Please see the below screenshot:
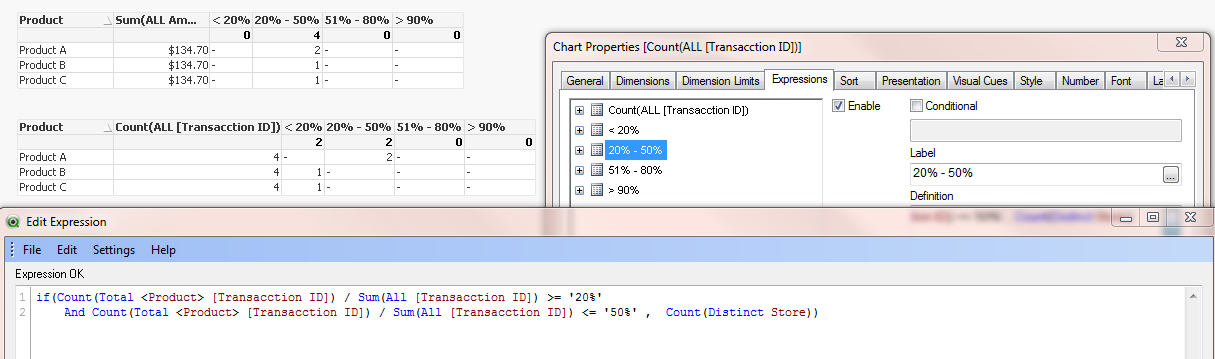
Hope this gives you an idea of how to approach your problem.
- Mark as New
- Bookmark
- Subscribe
- Mute
- Subscribe to RSS Feed
- Permalink
- Report Inappropriate Content
Hi Is not working because Is not making the Formula by each store, is making a global formula
- Mark as New
- Bookmark
- Subscribe
- Mute
- Subscribe to RSS Feed
- Permalink
- Report Inappropriate Content
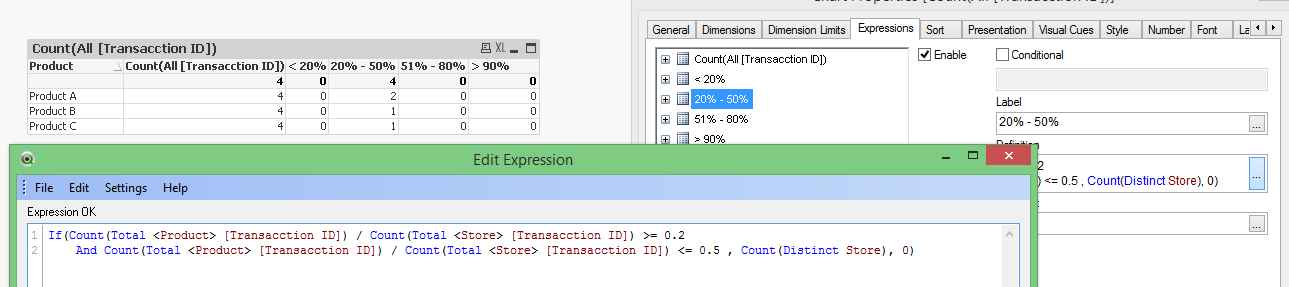
It seems like I had a flaw in my formula. How about the below:
Thanks
- Mark as New
- Bookmark
- Subscribe
- Mute
- Subscribe to RSS Feed
- Permalink
- Report Inappropriate Content
Hello
I can I send you a file with the detail??
Regards
- Mark as New
- Bookmark
- Subscribe
- Mute
- Subscribe to RSS Feed
- Permalink
- Report Inappropriate Content
Hi I publish the file with the datail of this case under Porcentage transacctions by store (Attachment)
Regards
- « Previous Replies
-
- 1
- 2
- Next Replies »