Unlock a world of possibilities! Login now and discover the exclusive benefits awaiting you.
- Qlik Community
- :
- All Forums
- :
- QlikView App Dev
- :
- SUM() incorrectly totaling terms
- Subscribe to RSS Feed
- Mark Topic as New
- Mark Topic as Read
- Float this Topic for Current User
- Bookmark
- Subscribe
- Mute
- Printer Friendly Page
- Mark as New
- Bookmark
- Subscribe
- Mute
- Subscribe to RSS Feed
- Permalink
- Report Inappropriate Content
SUM() incorrectly totaling terms
Hi all,
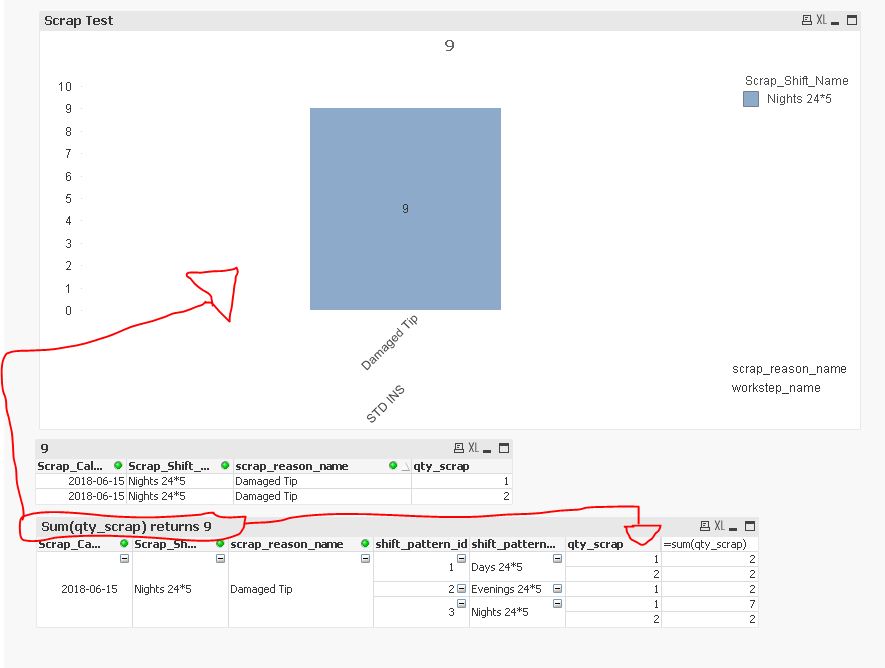
I've been experiencing a problem whereby I am trying to display the total quantity of a field however whenever I use the SUM function it occasionally gives me a number which is higher than the actual value. I have tried multiple things including removing all associations and renaming everything so that it's unique and loading just the single table which contains all of the values I'm trying to sum.
Regardless of what I've tried the SUM function is constantly returns a result higher than that what the Pivot tables are showing me or the pivot tables are wrong or I completely misunderstand how the SUM function works. In either case I do not know how to rectify this, any suggestions would be hugely appreciated.
I have attached screen shots demonstrating the problem.
- Tags:
- chart
- sum not working
Accepted Solutions
- Mark as New
- Bookmark
- Subscribe
- Mute
- Subscribe to RSS Feed
- Permalink
- Report Inappropriate Content
You have discovered the "Sum of Rows" discrepancy when summing Pivot tables.
Straight tables allow you to choosed whether Qlik calculat the total by recalculating the expression excluding the dimensions, or to sum the rows.
In a pivot table you do not get the choice, the sum is always recalculated excluding the lower dimenions.
To work around this you need to use a AGGR expression such as
sum(aggr(your_expression, dimension1, dimension2, ...dimensionN)
This is detailed in the help file and there are many posts here showing examples.
- Mark as New
- Bookmark
- Subscribe
- Mute
- Subscribe to RSS Feed
- Permalink
- Report Inappropriate Content
What is the expr used for your bar chart?
- Mark as New
- Bookmark
- Subscribe
- Mute
- Subscribe to RSS Feed
- Permalink
- Report Inappropriate Content
Convert your bar chart to a straight table and you will see that sum(qty_scrap) is returning 9
I would suggest adding your key fields (workstep_id and downtime_log_id) as dimensions to the straight table so you can see how the qty_scrap values total to 9.
Your table box will only show distinct values and will not show you where there are duplicates.
- Mark as New
- Bookmark
- Subscribe
- Mute
- Subscribe to RSS Feed
- Permalink
- Report Inappropriate Content
Right okay I think I understand. I did a bit of reading and I think I understand the difference between the 2. I assumed the problem was the formula however it was the type of table I was using, I used the sum(aggr(NoDISTINCT qty_scrap,qty_scrap)) and it seems to be correct. I didn't realize that the straight table was telling me what number occurred but not how many times that it occurred.
Thank you massively!
- Mark as New
- Bookmark
- Subscribe
- Mute
- Subscribe to RSS Feed
- Permalink
- Report Inappropriate Content
I was using SUM(qty_scrap)