Unlock a world of possibilities! Login now and discover the exclusive benefits awaiting you.
- Qlik Community
- :
- All Forums
- :
- QlikView App Dev
- :
- Rolling issue
- Subscribe to RSS Feed
- Mark Topic as New
- Mark Topic as Read
- Float this Topic for Current User
- Bookmark
- Subscribe
- Mute
- Printer Friendly Page
- Mark as New
- Bookmark
- Subscribe
- Mute
- Subscribe to RSS Feed
- Permalink
- Report Inappropriate Content
Rolling issue
Hi
I have attached an example of QVW that illustrates the problem that I have.
INTRODUCTION:
In summary, the example contains just 2 tables:
- MasterCalendar
- Jobs file
The 2 are linked by a date that I call OrderDate
The "Jobs" file has a number of fields but the ones of interest are:
- No - this is the job number (this is not unique as there can be a number of entries for the same "job"
- Amount - This is the amount charged for each job
We have data spaning 4 years
REQUIREMENT:
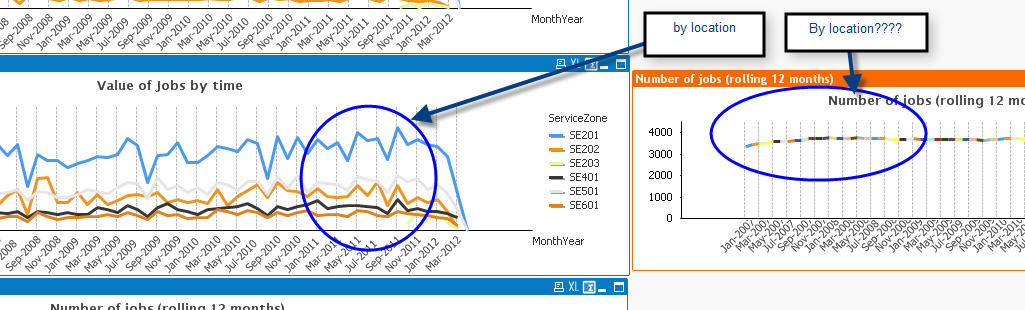
We need to show both monthly totals (as in the example) and 12-month rolling averages against time. Just to clarify, for each month we need to show the average of the 12 previous months as at that time (e.g. for Jan 2011 it should show the average of Feb 2010 through to Jan 2011). This needs to be broken down by location as shown in my example for the totals.
The location dimension appears to be confusing QlikView. Any pointers would be highly appreciated.
Thanx in advance
Alexis
- « Previous Replies
-
- 1
- 2
- Next Replies »
Accepted Solutions
- Mark as New
- Bookmark
- Subscribe
- Mute
- Subscribe to RSS Feed
- Permalink
- Report Inappropriate Content
Do you have a set number of locations? I know the Rangeavg and Above functions don't seem to like more than 1 dimension. (Could try total?)
If the number of locations will not change you could create an expression for each. then use set analysis to limit each expression to the correct location. That should make it so the avg only flows for each location
- Mark as New
- Bookmark
- Subscribe
- Mute
- Subscribe to RSS Feed
- Permalink
- Report Inappropriate Content
Try an expression like this?
Rangeavg( Above (count({$<Year =, Month =, OrderDate =>} DISTINCT [No]),0,12))
I am not sure if I completly get what you are looking for. The {$<Year =, Month =, OrderDate =>} will make it so selections to date wont affect the chart so it will show correctly. (IE It needs all data for months to show correct avg.)
- Mark as New
- Bookmark
- Subscribe
- Mute
- Subscribe to RSS Feed
- Permalink
- Report Inappropriate Content
You mean link for field JobDate not for OrderDate or i missing something?
- Mark as New
- Bookmark
- Subscribe
- Mute
- Subscribe to RSS Feed
- Permalink
- Report Inappropriate Content
Apologies Alfasierra - I renamed some of the field names to make it easier to understand.. yes you are right - the link field is "JobDate".
- Mark as New
- Bookmark
- Subscribe
- Mute
- Subscribe to RSS Feed
- Permalink
- Report Inappropriate Content
Hi Marc,
Thanx for responding.
I would like to show the entire timeline (Jan 2007 - now) broken by month (as in the example attached) - for the "rolling" part this should be previous 12 months (if available).
For example:
For March 2007 for example it will be the average of Jan 2007 - March 2007 (only 3 values are available)
For Nov 2007 for example it will be the average of Jan 2007 - Nov 2007 (only 11 values are available)
For Mar 2008 for example it will be the average of Apr 2007 - Mar 2008 (last 12 values)
For Jan 2012 for example it will be the average of Feb 2011 - Jan 2012 (last 12 values)
etc..
- Mark as New
- Bookmark
- Subscribe
- Mute
- Subscribe to RSS Feed
- Permalink
- Report Inappropriate Content
Correct that should be what
Rangeavg( Above (count({$<Year =, Month =, OrderDate =>} DISTINCT [No]),0,12))
is doing.
It takes the distinct count of jobs per dimension, then it averages the previous 11 (12 including the current month)
- Mark as New
- Bookmark
- Subscribe
- Mute
- Subscribe to RSS Feed
- Permalink
- Report Inappropriate Content
Tried the rangeavg approach and I don't seem to be getting the "separation" that I expect. For a start I am not getting rolling values by location (see chart below) - it seems that "rolling" does not like more than one dimension to be present in the chart.
- Mark as New
- Bookmark
- Subscribe
- Mute
- Subscribe to RSS Feed
- Permalink
- Report Inappropriate Content
Alexis did u try this?
Sum({< Year = , Month = , JobDate={">=$(=AddMonths(MonthStart(Today()), -12))<=$(=(AddMonths(Today(), 0)))"} >} Amount)
- Mark as New
- Bookmark
- Subscribe
- Mute
- Subscribe to RSS Feed
- Permalink
- Report Inappropriate Content
alfasierra wrote:
Alexis did u try this?
Sum({< Year = , Month = , JobDate={">=$(=AddMonths(MonthStart(Today()), -12))<=$(=(AddMonths(Today(), 0)))"} >} Amount)
Yes I did Alfasierra and getting the same behaviour - I know my document is a little on the large size but have you downloaded to see the problem that I am reporting?
Thanx again
Alexis
- Mark as New
- Bookmark
- Subscribe
- Mute
- Subscribe to RSS Feed
- Permalink
- Report Inappropriate Content
Do you have a set number of locations? I know the Rangeavg and Above functions don't seem to like more than 1 dimension. (Could try total?)
If the number of locations will not change you could create an expression for each. then use set analysis to limit each expression to the correct location. That should make it so the avg only flows for each location
- « Previous Replies
-
- 1
- 2
- Next Replies »