Unlock a world of possibilities! Login now and discover the exclusive benefits awaiting you.
- Qlik Community
- :
- All Forums
- :
- QlikView App Dev
- :
- Rank, Aggr to sort expression values in a descendi...
- Subscribe to RSS Feed
- Mark Topic as New
- Mark Topic as Read
- Float this Topic for Current User
- Bookmark
- Subscribe
- Mute
- Printer Friendly Page
- Mark as New
- Bookmark
- Subscribe
- Mute
- Subscribe to RSS Feed
- Permalink
- Report Inappropriate Content
Rank, Aggr to sort expression values in a descending order?
I'm working on a dashboard for a client, hence why I cannot post examples.
I have table boxes displaying Revenue for Top 5 courses, when I select a country/region, the courses are displayed in a rank from highest to lowest revenue. When I make a data range selection, the rank does not apply any longer, instead the names of the courses remain in the same, but the revenue changes, meaning course 2 has lower revenue than course 5, meaning these two courses should swap places.
Example:

Now when I select a month, this happens:
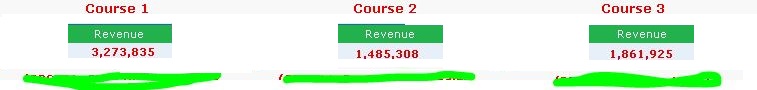
you can see how course 3 had a higher revenue than course 2. Any idea how I can get QlikView to sort the courses when I make a date selection?
This is what I use to calculate the top revenue courses:
Aggr(NODISTINCT Rank(Sum({$<Year=, Month=, YearMonth=,
CourseGroupName-={'Expense', 'Other'}, CourseCode-={'Company Course'}>} $(Revenue))), CourseCode)
any ideas?
- Tags:
- aggr
- rank
- setanalysis
- Mark as New
- Bookmark
- Subscribe
- Mute
- Subscribe to RSS Feed
- Permalink
- Report Inappropriate Content
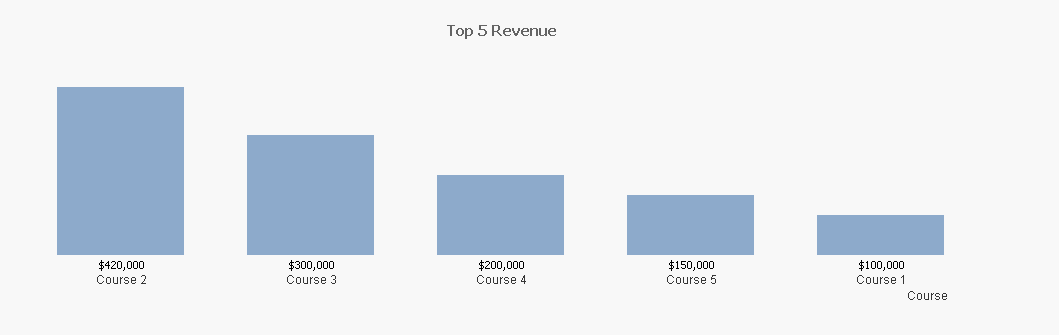
Hello,
Maybe you can change the presentation using a bar char and present top 5 or top3 Courses and just display revenue order by Y Value.
Best regards.
- Mark as New
- Bookmark
- Subscribe
- Mute
- Subscribe to RSS Feed
- Permalink
- Report Inappropriate Content
just an idea, what about something like
AGGR(nodistinct if(Rank(sum(Expression1))=N,sum(Expression1)), Product)
where N = 1, 2, 3, 4, 5