Unlock a world of possibilities! Login now and discover the exclusive benefits awaiting you.
- Qlik Community
- :
- All Forums
- :
- QlikView App Dev
- :
- Problem with printing Y-axis values
- Subscribe to RSS Feed
- Mark Topic as New
- Mark Topic as Read
- Float this Topic for Current User
- Bookmark
- Subscribe
- Mute
- Printer Friendly Page
- Mark as New
- Bookmark
- Subscribe
- Mute
- Subscribe to RSS Feed
- Permalink
- Report Inappropriate Content
Problem with printing Y-axis values
Hello!
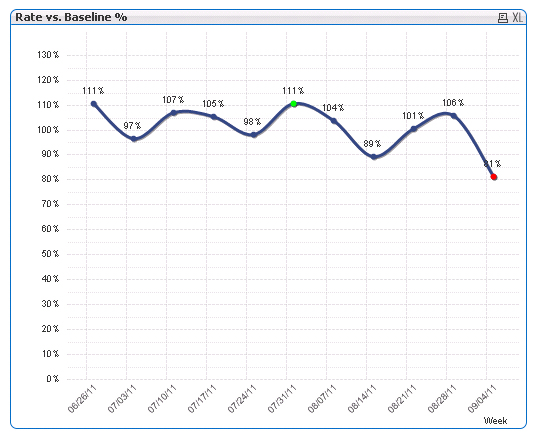
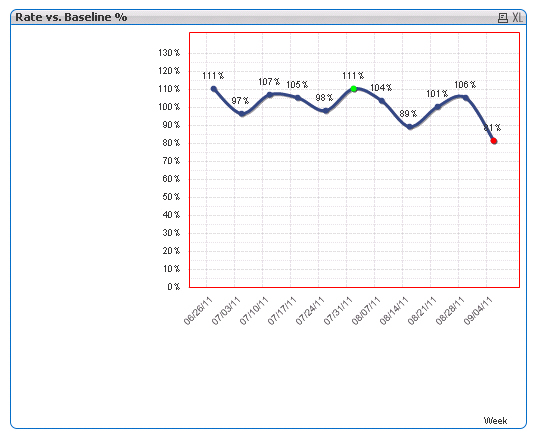
I have problem printing Y-axis values on Line and Bar charts: numbers are partially truncated.
Here is the chart example:
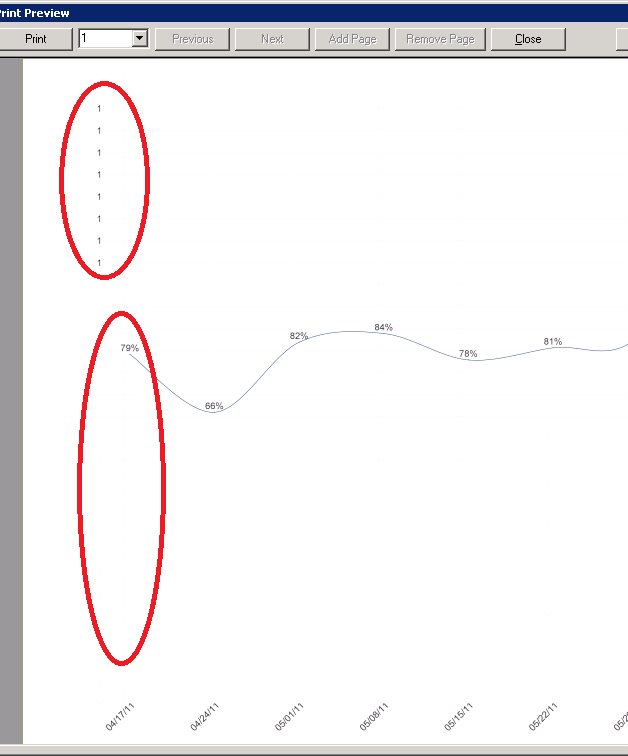
Print preview (only "1s" is visible for "1xx %" and nothing is visible for values below 100%):
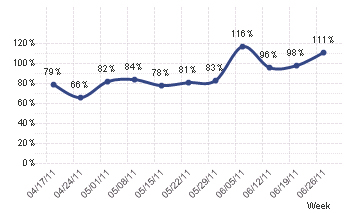
Copy chart image works fine:
I do realize that I've messed up the axis area somehow and my problem is how to reset it back.
I've created identical chart and it works perfectly fine:
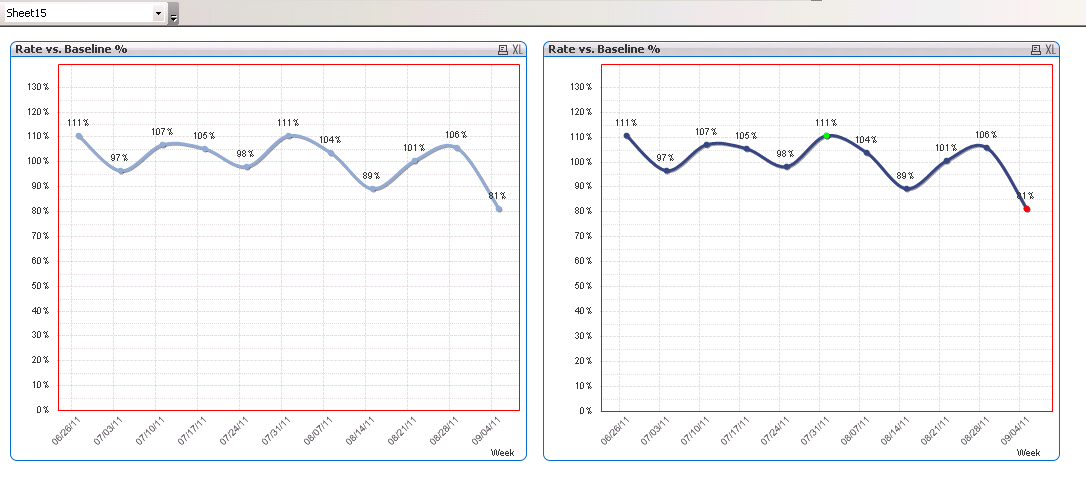
Chart on the left is the newly created one; chart on the right has printing problems. I've adjusted plotting areas and sizes to identical values, but still have my printing problem with the chart on the right.
After several manipulations I've adjusted the plotting/axis areas to sizes where all Y-axis values are visible on the printed page, but the chart occupies only ~60% of the original area now:
Any suggestions how to fix my problem the other way? I have this issue with almost every chart in the application and I would like to avoid the situation when I have to redo all charts from scratch again.
Looking forward for suggestions.
Best regards,
Vladimir Komarov
QV Consultant
Natural Synergies
Accepted Solutions
- Mark as New
- Bookmark
- Subscribe
- Mute
- Subscribe to RSS Feed
- Permalink
- Report Inappropriate Content
Thanks to Oleg Troyansky (http://community.qlik.com/people/troyansky), I was able to resolve the issue.
You need to click on "Reset User Sizing" and "Reset User Docking" on chart's properties (General Tab).