Unlock a world of possibilities! Login now and discover the exclusive benefits awaiting you.
- Qlik Community
- :
- All Forums
- :
- QlikView App Dev
- :
- Pivot table issue
- Subscribe to RSS Feed
- Mark Topic as New
- Mark Topic as Read
- Float this Topic for Current User
- Bookmark
- Subscribe
- Mute
- Printer Friendly Page
- Mark as New
- Bookmark
- Subscribe
- Mute
- Subscribe to RSS Feed
- Permalink
- Report Inappropriate Content
Pivot table issue
Hi guys,
How can I build a pivot table like below
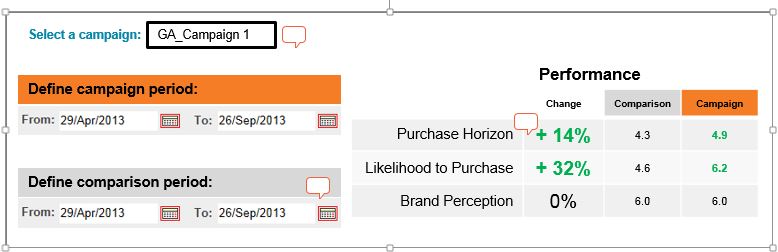
It's 3 different variables and I need to add 3 columns.
Please find my file to understand better.
Maybe better use avg in Load script.
For selection 2 periods I use triggers (for oDate and oDate1).
Thanks,
- Tags:
- new_to_qlikview
- Mark as New
- Bookmark
- Subscribe
- Mute
- Subscribe to RSS Feed
- Permalink
- Report Inappropriate Content
Calendar object is correct may be you can use Text objects for Performance calculation with its calculation formula weather from expression or variables.
- Mark as New
- Bookmark
- Subscribe
- Mute
- Subscribe to RSS Feed
- Permalink
- Report Inappropriate Content
May be, but the problem not always I have 3 variables and I'm limited with space.
Thanks,
- Mark as New
- Bookmark
- Subscribe
- Mute
- Subscribe to RSS Feed
- Permalink
- Report Inappropriate Content
Your field needs not to be a data island, it needs to associate into (or be part of) your main fact table.
Presently you have three expressions for Purchase Horizon, Likelihood and Brand. The three expressions should be instead be Change, Comparison and Campaign.
To get the layout you should change from being a Pivot Table to being a Straight Table (on the General tab) and then change the display to be Horizontal on the Presentation tab.
You will be able to do some conditional formatting on the background and text colours, but will not be able to get quite the look you have there with a straight table. The only way to get that would be to use text objects - but that would not flex if you had more dimensions (it's also trickier to maintain).
Personally I would use the date variables in Set Analysis rather than applying selections; this way you can do comparative expressions easier. You will find plenty of Set Analysis examples on the Community - there are a couple I have uploaded, for example.
Hope that helps point you in the correct direction.
Regards,
Steve
- Mark as New
- Bookmark
- Subscribe
- Mute
- Subscribe to RSS Feed
- Permalink
- Report Inappropriate Content
It sounds like I need.
Then I need to think how to hide, if there is no 1 or 2 variables.
Thanks,
- Mark as New
- Bookmark
- Subscribe
- Mute
- Subscribe to RSS Feed
- Permalink
- Report Inappropriate Content
If you go the route I suggested - having the Field field joined to the main data table, the Straight Table should flex to give you the number of rows you require.
Good luck!
- Mark as New
- Bookmark
- Subscribe
- Mute
- Subscribe to RSS Feed
- Permalink
- Report Inappropriate Content
Other words, I need to add variable Field to main file?
I have 3 expression with set analysis.
All results are the same. Because variable Field doesn't associate with any variable from main file.
Could you have a look at my file.
Thanks,
- Mark as New
- Bookmark
- Subscribe
- Mute
- Subscribe to RSS Feed
- Permalink
- Report Inappropriate Content
Hi Vladimir,
I have done a number of QlikView apps over survey data and I would strongly recommend that you CrossTable your data.
This way instead of having separate columns for each of the results you will have a single 'Result' column and a row (four initially) for each of the different answers for each survey, with a QuestionID next to each value. The record set would be something like:
SurveyDate,Campaign,QuestionID,Result
You can then either link to a Questions table on the ID or pull the Question into the data set directly (perhaps with ApplyMap).
Once you have done this you can use the Question Name as a dimension and calculate all of the associated values.
The real beauty of this is that you can have different number of questions for each campaign and the data just flexes to accommodate the new or removed questions. Your app can grow and grow with no changes to the data model or the presentation.
You should find plenty of information on CrossTable and ApplyMap if you search for it.
Hope that helps,
Steve