Unlock a world of possibilities! Login now and discover the exclusive benefits awaiting you.
- Qlik Community
- :
- All Forums
- :
- QlikView App Dev
- :
- Pivot table: how to force Sum in totals
- Subscribe to RSS Feed
- Mark Topic as New
- Mark Topic as Read
- Float this Topic for Current User
- Bookmark
- Subscribe
- Mute
- Printer Friendly Page
- Mark as New
- Bookmark
- Subscribe
- Mute
- Subscribe to RSS Feed
- Permalink
- Report Inappropriate Content
Pivot table: how to force Sum in totals
Hi guys, one question.
I experienced the following issue.
I have a source Excel file like that (I copied just the first rows; attached the file).
| Store | Hour | ReceiptPOSDay | Product | Value |
| STORE A | 08:00 | 0070000000120140131 | 0999103 | 278,00 |
| STORE A | 08:00 | 0070000000120140131 | 0999300 | -278,00 |
| STORE A | 08:00 | 0070000000220140131 | 0999103 | 255,00 |
I created a simple Pivot Table with Hour and Store as dimensions and "Count (DISTINCT ReceiptPOSDay)" as Expression.
Below the Pivot table :
| Hour | Store | Count (DISTINCT ReceiptPOSDay) |
| 08:00 | STORE A | 435 |
| 08:00 | STORE B | 4 |
| 08:00 | STORE C | 24 |
| 08:00 | STORE D | 31 |
| 08:00 | STORE E | 26 |
| 08:00 | Total | 519 |
| Total | 519 |
The problem I'm facing is that I'd like to have the "Total" as sum of the figures of the last column. To be more precise I'd like to see 520 (435+4+24+31+26=520) as Total. Do you know if there is a way to have this result as Total?
One more question: do you know how Qlikview calculate 519??
Thanks a lot
Gncwal
Accepted Solutions
- Mark as New
- Bookmark
- Subscribe
- Mute
- Subscribe to RSS Feed
- Permalink
- Report Inappropriate Content
Try this:
Sum(Aggr(Count (DISTINCT ReceiptPOSDay), Hour, Store))
Output:
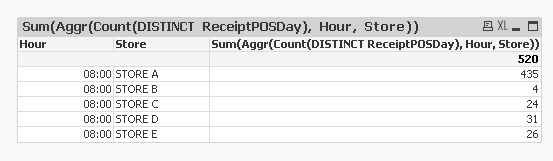
And to answer your other question why the sum is coming as 519. One of the ReceiptPOSDay might be getting repeated in two stores making it distinct for that store but not distinct overall.
- Mark as New
- Bookmark
- Subscribe
- Mute
- Subscribe to RSS Feed
- Permalink
- Report Inappropriate Content
Try this:
Sum(Aggr(Count (DISTINCT ReceiptPOSDay), Hour, Store))
Output:
And to answer your other question why the sum is coming as 519. One of the ReceiptPOSDay might be getting repeated in two stores making it distinct for that store but not distinct overall.
- Mark as New
- Bookmark
- Subscribe
- Mute
- Subscribe to RSS Feed
- Permalink
- Report Inappropriate Content
Hi
See the attached qvw
- Mark as New
- Bookmark
- Subscribe
- Mute
- Subscribe to RSS Feed
- Permalink
- Report Inappropriate Content
It works!
Thanks everybody for your reply!!
- Mark as New
- Bookmark
- Subscribe
- Mute
- Subscribe to RSS Feed
- Permalink
- Report Inappropriate Content
No problem 
I am glad I was able to help.
Best,
Sunny