Unlock a world of possibilities! Login now and discover the exclusive benefits awaiting you.
- Qlik Community
- :
- All Forums
- :
- QlikView App Dev
- :
- Pie Chart Values are Overlapping
Options
- Subscribe to RSS Feed
- Mark Topic as New
- Mark Topic as Read
- Float this Topic for Current User
- Bookmark
- Subscribe
- Mute
- Printer Friendly Page
Turn on suggestions
Auto-suggest helps you quickly narrow down your search results by suggesting possible matches as you type.
Showing results for
Creator II
2017-10-26
02:06 AM
- Mark as New
- Bookmark
- Subscribe
- Mute
- Subscribe to RSS Feed
- Permalink
- Report Inappropriate Content
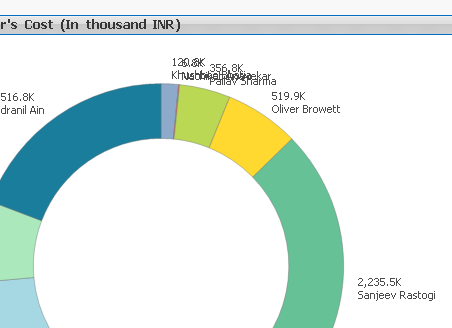
Pie Chart Values are Overlapping
Hi All
i trying to create a pie chart with Dimension: Function,
1.Expression : =fabs(Max(Aggr(Num(Sum([Invoice Value]/1000),'#,##0'),Function1,PaxName)))
2.Expression : =FirstSortedValue(Distinct PaxName,-aggr(Sum([Invoice Value]),Function1, PaxName),1)
the Values are overlapping like below, for that i tried to use repeat and rank function to solve but not succesded.
Can any one suggest.
Thanks
Rajesh
556 Views
1 Reply
MVP
2017-10-26
02:16 AM
- Mark as New
- Bookmark
- Subscribe
- Mute
- Subscribe to RSS Feed
- Permalink
- Report Inappropriate Content
Have a look here: Mapt - Developer skills delivered
374 Views