Unlock a world of possibilities! Login now and discover the exclusive benefits awaiting you.
- Qlik Community
- :
- All Forums
- :
- QlikView App Dev
- :
- Need Ideas for Visualization
- Subscribe to RSS Feed
- Mark Topic as New
- Mark Topic as Read
- Float this Topic for Current User
- Bookmark
- Subscribe
- Mute
- Printer Friendly Page
- Mark as New
- Bookmark
- Subscribe
- Mute
- Subscribe to RSS Feed
- Permalink
- Report Inappropriate Content
Need Ideas for Visualization
I have a column named Project Stage with values like New, Initiation, Deployment etc.
I want to show the status of each project like this:
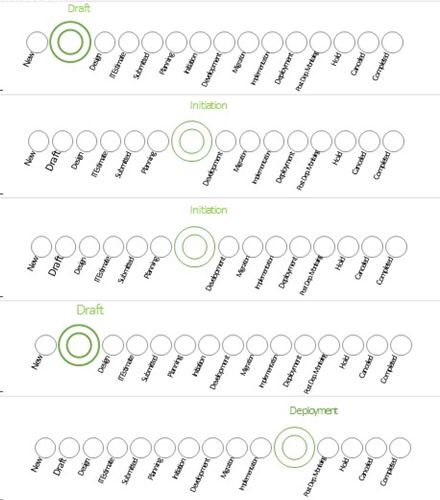
The stage in which the project is currently in, that stage should be shown like in the above image.
Can someone help me with this? Is is doable in qlikview?
Thanks,
Yash
- Mark as New
- Bookmark
- Subscribe
- Mute
- Subscribe to RSS Feed
- Permalink
- Report Inappropriate Content
You could use a Grid-Chart
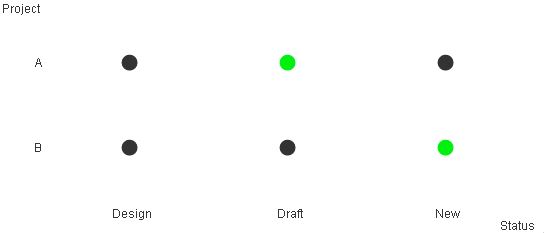
Matthias
- Mark as New
- Bookmark
- Subscribe
- Mute
- Subscribe to RSS Feed
- Permalink
- Report Inappropriate Content
I think you won't get a layout like in your example but there will be ways to displays this kind of information maybe within a pivot-table or a (stacked?) bar-chart. Maybe the following could give you some ideas:
Files for creation of a Gantt chart
How to create a Gantt chart using a Pivot table
Gantt Chart Extension Object (version 2.0)
- Marcus
- Mark as New
- Bookmark
- Subscribe
- Mute
- Subscribe to RSS Feed
- Permalink
- Report Inappropriate Content
Thank you for sharing the links Marcus. I went through those but I dont have the dates when the Project Stage changes in my data model.
- Mark as New
- Bookmark
- Subscribe
- Mute
- Subscribe to RSS Feed
- Permalink
- Report Inappropriate Content
I think this doesn't matter because in each way you will need to use some generic data like 1,2,3, ... instead of the dates and/or =1 as chart-expression or something similar - because a chart need numbers to display data.
Before I would try the suggestion from Matthias which looks quite nice and is probably easier to implement.
- Marcus