Unlock a world of possibilities! Login now and discover the exclusive benefits awaiting you.
- Qlik Community
- :
- All Forums
- :
- QlikView App Dev
- :
- Multiply out matching rows in same table (Weighted...
- Subscribe to RSS Feed
- Mark Topic as New
- Mark Topic as Read
- Float this Topic for Current User
- Bookmark
- Subscribe
- Mute
- Printer Friendly Page
- Mark as New
- Bookmark
- Subscribe
- Mute
- Subscribe to RSS Feed
- Permalink
- Report Inappropriate Content
Multiply out matching rows in same table (Weighted Average)
Hi all, need some help please.
I have a single large table which contains a union of several Monthly data sections imported from Excel, e.g. Section B values represent number of switches of accounts, and Section C represents the average switching time of these accounts, I have 2 different values for Domestic and Non-Domestic.
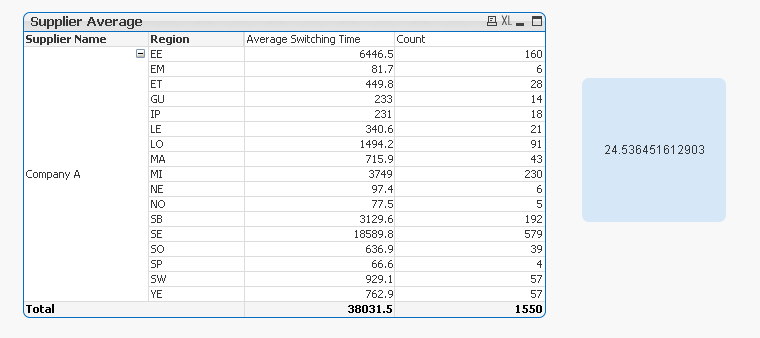
I need to create a Pivot chart broken down by File Month, Supplier showing the average switching time for all accounts.
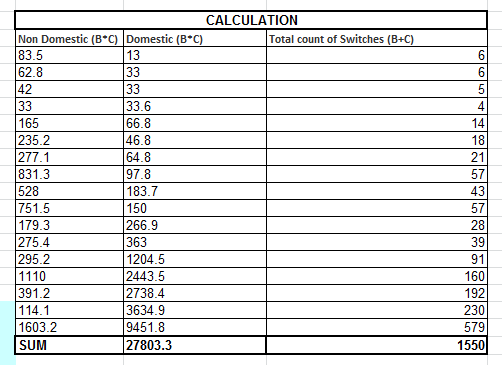
To achieve this I need to first of all multiply out the number of switches by the average switching time matching on Supplier and Region separately for both Domestic and non-domestic values, then sum the total of all these and finally divide by the total count of all switches.
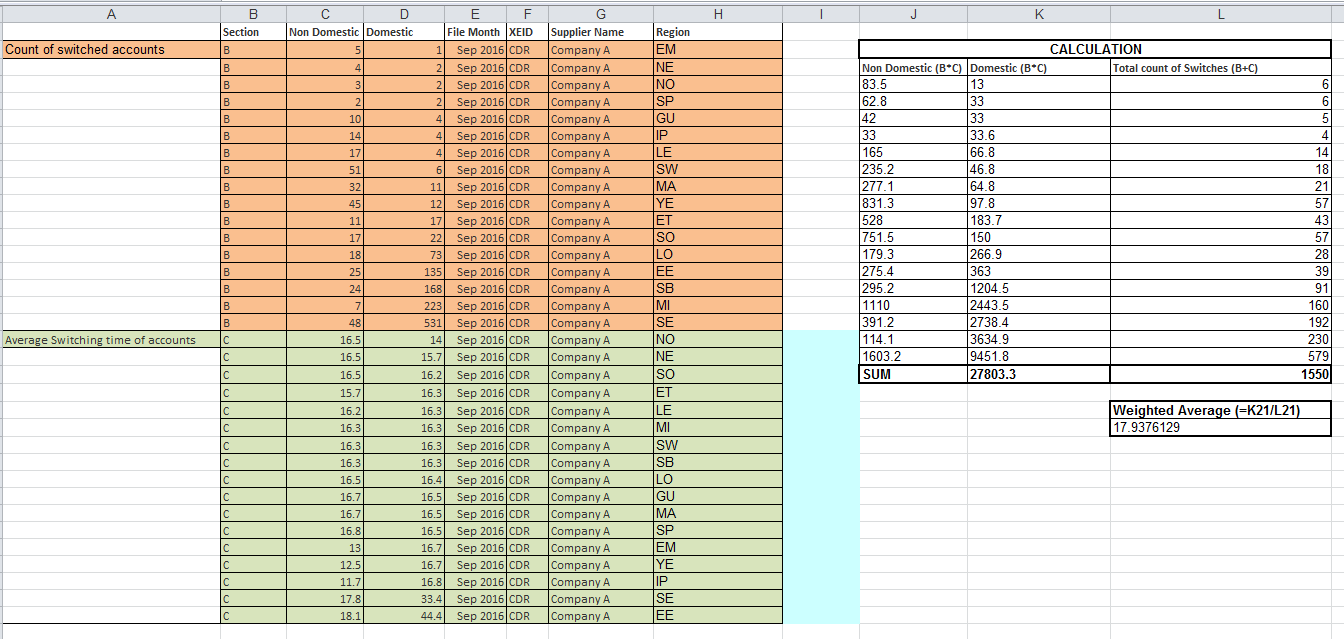
I have attached a data sample.
Any help much appreciated!
Accepted Solutions
- Mark as New
- Bookmark
- Subscribe
- Mute
- Subscribe to RSS Feed
- Permalink
- Report Inappropriate Content
Try this:
=Sum(Aggr(RangeSum(
Sum({<Section = {C}>}[Non Domestic]) * Sum({<Section = {B}>} [Non Domestic]),
Sum({<Section = {C}>}[Domestic]) * Sum({<Section = {B}>} [Domestic])), [Supplier Name], Region))
/
RangeSum(
Sum({<Section = {B}>}[Non Domestic]),
Sum({<Section = {B}>}[Domestic]))
Here the assumption was that the Region was the most granular information which made each row unique within a particular section. If you have more granular information, replace Region with that more granular field name in the Aggr function (colored in red above)
- Mark as New
- Bookmark
- Subscribe
- Mute
- Subscribe to RSS Feed
- Permalink
- Report Inappropriate Content
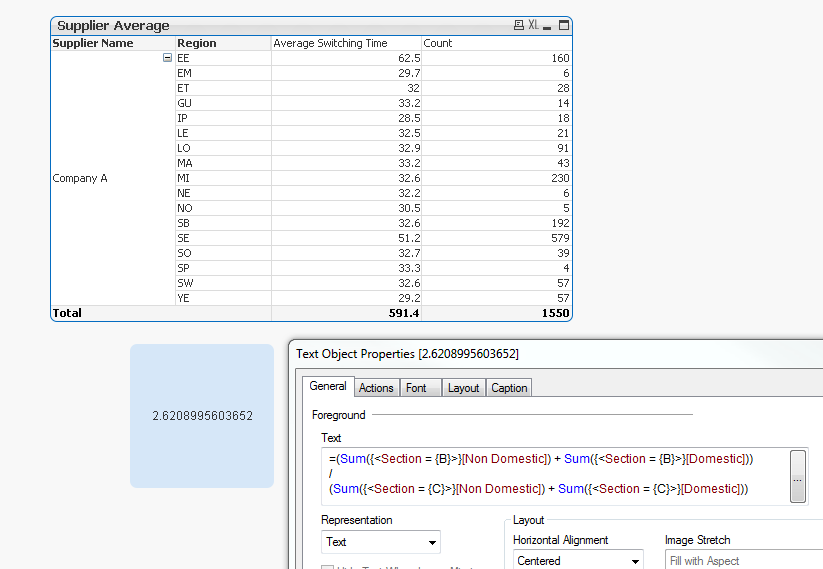
What is the expected number you are hoping to see here? 2.62 for the sample? If this is right, then try this:
=(Sum({<Section = {B}>}[Non Domestic]) + Sum({<Section = {B}>}[Domestic]))
/
(Sum({<Section = {C}>}[Non Domestic]) + Sum({<Section = {C}>}[Domestic]))
- Mark as New
- Bookmark
- Subscribe
- Mute
- Subscribe to RSS Feed
- Permalink
- Report Inappropriate Content
Hi Sunny, thanks for the reply, unfortunately this isn't quite what I need, the value should be as in the sample 17.97, I need to multiply the individual Non Domestic and Domestic count values separately by the corresponding switching times and then sum them and divide by the total of both.
sum(
(Domestic Count * Switching Time (each row))
,(Non-Domestic Count * Switching Time (each row))
)
/Sum(Total count of (Domestic + Non-Domestic)
I have a feeling this may not be possible because its kind of a row by row calculation, and the Pivot table inly has Supplier as dimension,but not sure.
Many thanks!
- Mark as New
- Bookmark
- Subscribe
- Mute
- Subscribe to RSS Feed
- Permalink
- Report Inappropriate Content
I think it is possible, but you need to explain how you are coming up with these numbers?
If I can come up with these numbers, I can come up with a solution. Can you may be show the formulas behind these numbers? Right now they are seem to be pasted as values
- Mark as New
- Bookmark
- Subscribe
- Mute
- Subscribe to RSS Feed
- Permalink
- Report Inappropriate Content
Hi, apologies I pasted the wrong values in the spreadsheet, I've now amended it and kept the formulas in.
Hope it makes sense now.
Many thanks!
- Mark as New
- Bookmark
- Subscribe
- Mute
- Subscribe to RSS Feed
- Permalink
- Report Inappropriate Content
Try this:
=Sum(Aggr(RangeSum(
Sum({<Section = {C}>}[Non Domestic]) * Sum({<Section = {B}>} [Non Domestic]),
Sum({<Section = {C}>}[Domestic]) * Sum({<Section = {B}>} [Domestic])), [Supplier Name], Region))
/
RangeSum(
Sum({<Section = {B}>}[Non Domestic]),
Sum({<Section = {B}>}[Domestic]))
Here the assumption was that the Region was the most granular information which made each row unique within a particular section. If you have more granular information, replace Region with that more granular field name in the Aggr function (colored in red above)
- Mark as New
- Bookmark
- Subscribe
- Mute
- Subscribe to RSS Feed
- Permalink
- Report Inappropriate Content
Hi, sorry for delay, this seems to work fine, I was also thinking that using ONLY without RangeSum might work but this is great.
Thanks again!
- Mark as New
- Bookmark
- Subscribe
- Mute
- Subscribe to RSS Feed
- Permalink
- Report Inappropriate Content
If you have finally got what you needed, I would suggest you to close this thread by marking correct and helpful responses.
Qlik Community Tip: Marking Replies as Correct or Helpful
Best,
Sunny