Unlock a world of possibilities! Login now and discover the exclusive benefits awaiting you.
- Qlik Community
- :
- All Forums
- :
- QlikView App Dev
- :
- Multicolor in graph
- Subscribe to RSS Feed
- Mark Topic as New
- Mark Topic as Read
- Float this Topic for Current User
- Bookmark
- Subscribe
- Mute
- Printer Friendly Page
- Mark as New
- Bookmark
- Subscribe
- Mute
- Subscribe to RSS Feed
- Permalink
- Report Inappropriate Content
Multicolor in graph
I have buildup a graph with, three expression in it. Qlikview assigned different color to each expression. One of my expression result into positive and negetive values. I need to refelct positive with different color and negetive with deifferent one.. Please Help
i have fair Idea of Data Appearance, and persistent color .. but unable to split one expression result in multi color. ?
Appreciate your comments..sss
- Tags:
- new_to_qlikview
- Mark as New
- Bookmark
- Subscribe
- Mute
- Subscribe to RSS Feed
- Permalink
- Report Inappropriate Content
You can use Visual Cues rules.
For each expression you can define forecolor and backcolor according to your needs (e.g. for numbers <= 0 you can define backcolor red).
- Mark as New
- Bookmark
- Subscribe
- Mute
- Subscribe to RSS Feed
- Permalink
- Report Inappropriate Content
In the expression tab you can open each expression.
If you do so you can set a conditional to the text color.
Adding an if-statement will do the trick.
For example:
If(Value>0, RGB(0,255,0), RGB(255,0,0))
- Mark as New
- Bookmark
- Subscribe
- Mute
- Subscribe to RSS Feed
- Permalink
- Report Inappropriate Content
Hi
Try like this
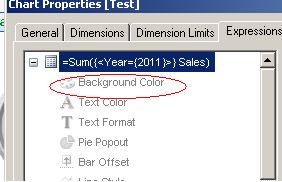
In that, = If( Sum(Sales) < 0, Red(), Green())
Please close the thread by marking correct answer & give likes if you like the post.
- Mark as New
- Bookmark
- Subscribe
- Mute
- Subscribe to RSS Feed
- Permalink
- Report Inappropriate Content
Hi, Atiq.
Have you tried using the Background Colour in the Expression ?
Click on the + on the Exoression to opeon up additional options. Within Background Colour put the code below (substituting Fieldname with the expression name)
if(Fieldname > 0, rgb(200, 0, 0), rgb(0, 200, 0))
This should mean positive numbers are green and negative numbers are red.
Regards,
Neil
- Mark as New
- Bookmark
- Subscribe
- Mute
- Subscribe to RSS Feed
- Permalink
- Report Inappropriate Content
Hi
goto expression tab -click on + on expression(expand the expression)
select back ground color-in the defintion write if condition like below
if(sum(Sales)>200000,red())
if u need negetive values in red color then follow below cond
if(sum(Sales)<0,red())
if ur using pivot or straight tables then
goto visual cues tab-give upper and lower values
for negetive values ,enter 0 as lower value and select color red
- Mark as New
- Bookmark
- Subscribe
- Mute
- Subscribe to RSS Feed
- Permalink
- Report Inappropriate Content
- Mark as New
- Bookmark
- Subscribe
- Mute
- Subscribe to RSS Feed
- Permalink
- Report Inappropriate Content
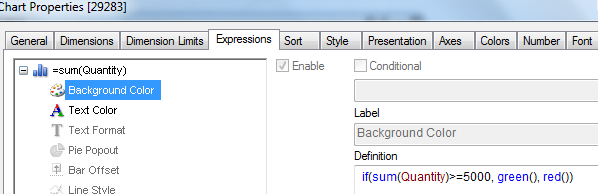
Hi Atiq,
in chart properties, Expression Tabe , Expend the expression>> background color, and write expression here.
like= if(sum(Value)>=0, Green(), Red())
Image below:
Khan