Unlock a world of possibilities! Login now and discover the exclusive benefits awaiting you.
- Qlik Community
- :
- All Forums
- :
- QlikView App Dev
- :
- Monthy Avg by Day
- Subscribe to RSS Feed
- Mark Topic as New
- Mark Topic as Read
- Float this Topic for Current User
- Bookmark
- Subscribe
- Mute
- Printer Friendly Page
- Mark as New
- Bookmark
- Subscribe
- Mute
- Subscribe to RSS Feed
- Permalink
- Report Inappropriate Content
Monthy Avg by Day
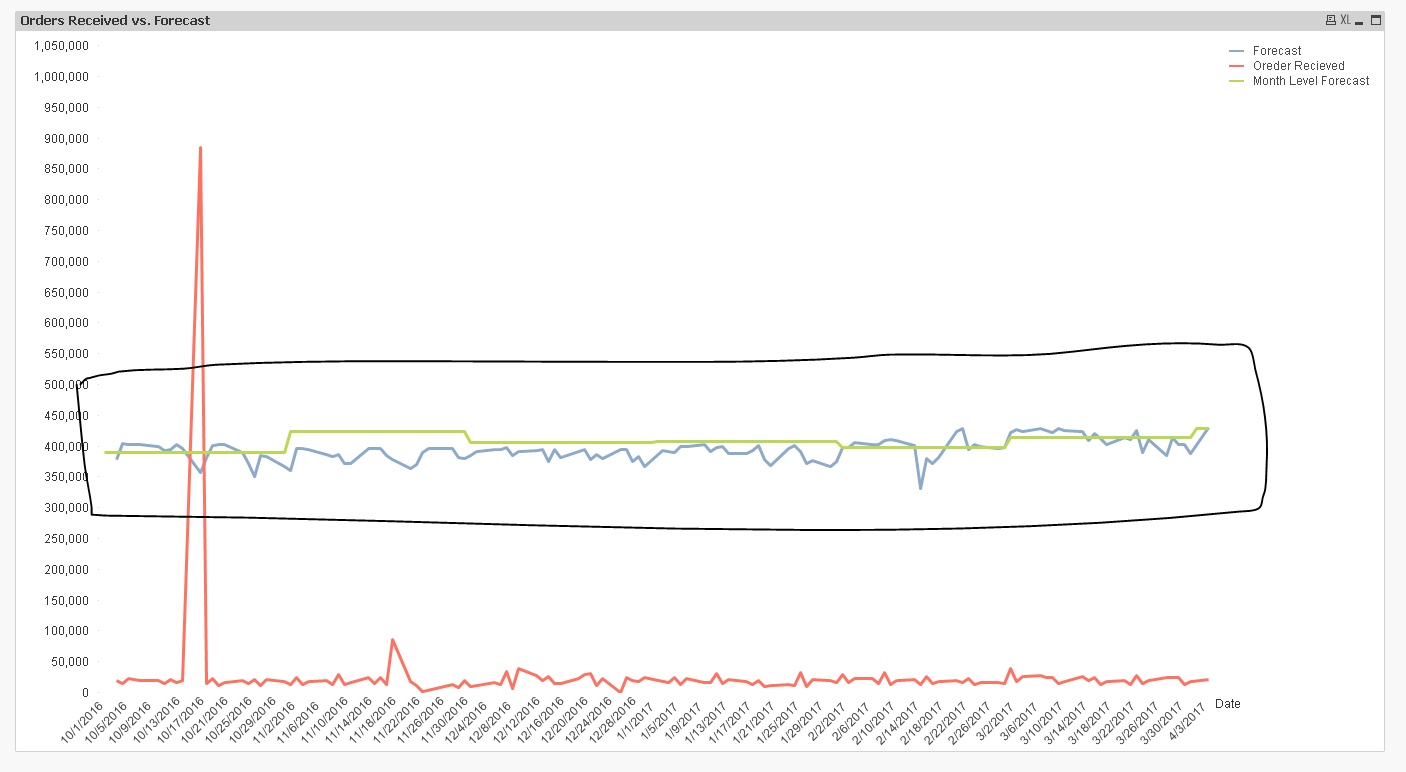
Hi All, I have an chart Forecast by Day. One KPI would be Monthly Avg Forecast by Day.
That is: sum(Forecast for each month)/Working day for each Month.
And the bar will be a straight line for one each Month.

I am attaching the App. Could you please help me to figure out Month Level Forecast.
Thanks,
Sarif
Accepted Solutions
- Mark as New
- Bookmark
- Subscribe
- Mute
- Subscribe to RSS Feed
- Permalink
- Report Inappropriate Content
WorkingDays were not even there in your expression.... Try this
=Sum(Aggr(Sum(TOTAL <CstFiscalPeriod> SalesForecastUnitsSnapshot/WorkingDays),CstFiscalPeriod, CstDate))
- Mark as New
- Bookmark
- Subscribe
- Mute
- Subscribe to RSS Feed
- Permalink
- Report Inappropriate Content
You need this in a text box object? May be try this
=Sum(SalesForecastUnitsSnapshot/WorkingDays)
- Mark as New
- Bookmark
- Subscribe
- Mute
- Subscribe to RSS Feed
- Permalink
- Report Inappropriate Content
No Sunny,
I need this in the chart.
In chart I have monthly level forecast in Green Line.

I need in this.
I am using below:
sum(aggr(sum(SalesForecastUnitsSnapshot),CstFiscalPeriod))/WorkingDays
But if I select one month it showing one dot. I need a straight line for one month.

Please help.
Thanks,
Sarif
- Mark as New
- Bookmark
- Subscribe
- Mute
- Subscribe to RSS Feed
- Permalink
- Report Inappropriate Content
May be this
=Sum(TOTAL Aggr(Sum(SalesForecastUnitsSnapshot),CstFiscalPeriod))
- Mark as New
- Bookmark
- Subscribe
- Mute
- Subscribe to RSS Feed
- Permalink
- Report Inappropriate Content
Or may be this
=Sum(Aggr(Sum(TOTAL <CstFiscalPeriod> SalesForecastUnitsSnapshot),CstFiscalPeriod, CstDate))
- Mark as New
- Bookmark
- Subscribe
- Mute
- Subscribe to RSS Feed
- Permalink
- Report Inappropriate Content
Yes.. I was trying use TOTAL, but could not use it Properly.
Thanks Sunny.
I am using :
=Sum(TOTAL Aggr(Sum(SalesForecastUnitsSnapshot),CstFiscalPeriod))/WorkingDays
Now,
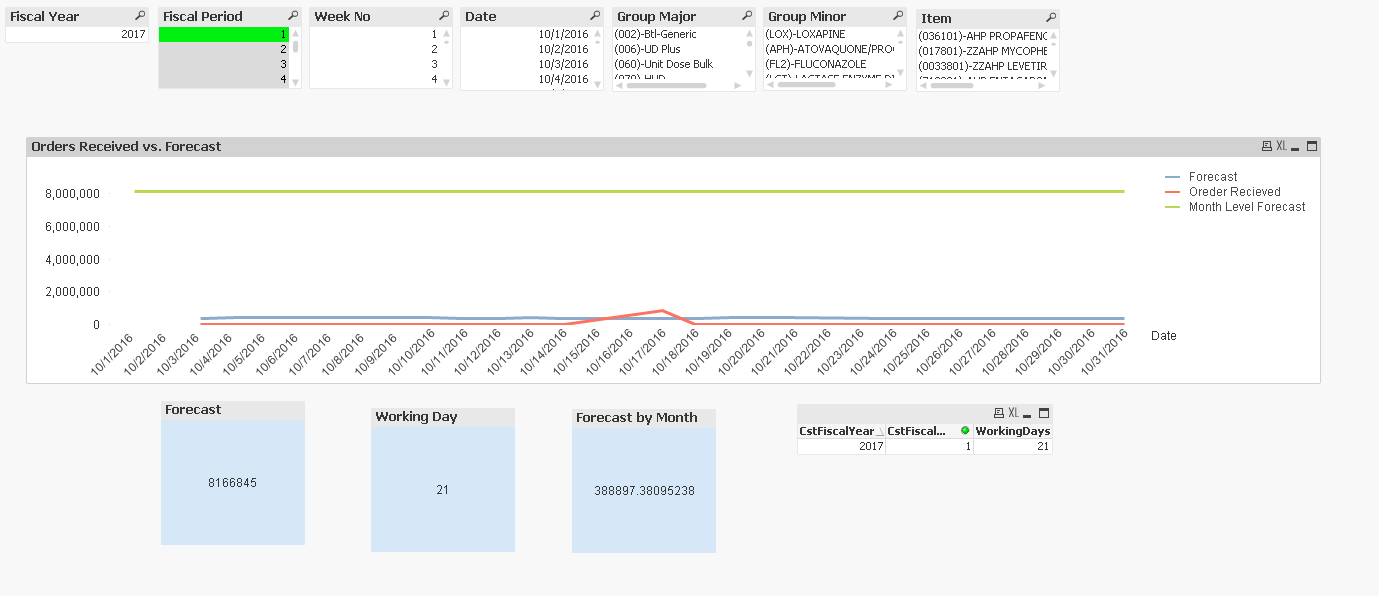
for Month1: 388897
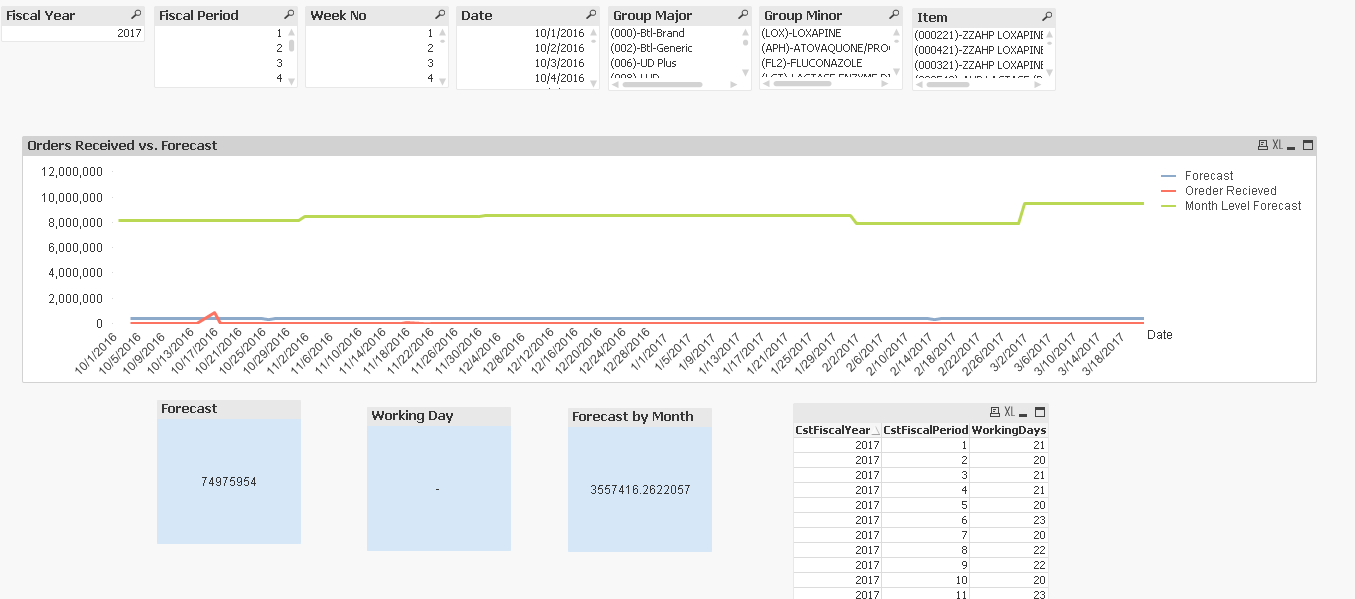
for Month2: 423599
For individual Month selection it is showing Correct. But If I select both Month 1 and 2, values are changing.
Might be Working days is not restricting for Month.
Could you please help on this.
Thanks,
Sarif
- Mark as New
- Bookmark
- Subscribe
- Mute
- Subscribe to RSS Feed
- Permalink
- Report Inappropriate Content
WorkingDays were not even there in your expression.... Try this
=Sum(Aggr(Sum(TOTAL <CstFiscalPeriod> SalesForecastUnitsSnapshot/WorkingDays),CstFiscalPeriod, CstDate))
- Mark as New
- Bookmark
- Subscribe
- Mute
- Subscribe to RSS Feed
- Permalink
- Report Inappropriate Content
WOW....  great.. I am just wondering why I am not able to do this by my own...
You are awesome.
Can you please help me to understand the function of <CstFiscalPeriod> in your expression.
Thanks,
Sarif
- Mark as New
- Bookmark
- Subscribe
- Mute
- Subscribe to RSS Feed
- Permalink
- Report Inappropriate Content
It is used with TOTAL Qualifier which tells the expression the scope of the aggregation.