Unlock a world of possibilities! Login now and discover the exclusive benefits awaiting you.
- Qlik Community
- :
- All Forums
- :
- QlikView App Dev
- :
- Months comparison in % as Expression
- Subscribe to RSS Feed
- Mark Topic as New
- Mark Topic as Read
- Float this Topic for Current User
- Bookmark
- Subscribe
- Mute
- Printer Friendly Page
- Mark as New
- Bookmark
- Subscribe
- Mute
- Subscribe to RSS Feed
- Permalink
- Report Inappropriate Content
Months comparison in % as Expression
Hi everyone!
I want to show a line chart with % variation for each month and quarter. (Both Quantity and Value)
Script is as below
LOAD Date,
Year (Date) as Year,
Month (Date) as Month,
Day (Date) as Day,
MonthName (Date) as YearMonth,
Org,
Qty,
Value
...............................
Also please find attached the Data file.
Best Regards
- « Previous Replies
-
- 1
- 2
- Next Replies »
Accepted Solutions
- Mark as New
- Bookmark
- Subscribe
- Mute
- Subscribe to RSS Feed
- Permalink
- Report Inappropriate Content
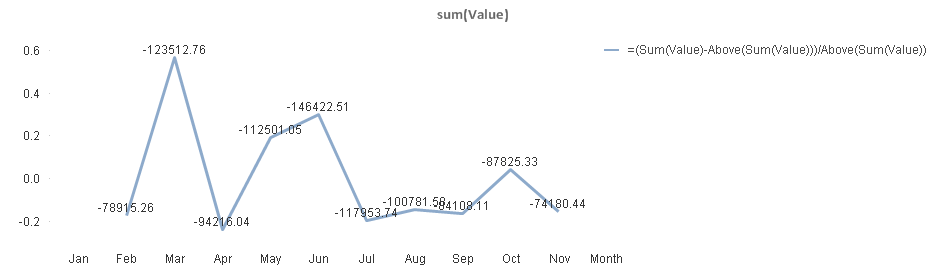
May be like this:
Expression: =(Sum(Qty)-Above(Sum(Qty)))/Above(Sum(Qty))
- Mark as New
- Bookmark
- Subscribe
- Mute
- Subscribe to RSS Feed
- Permalink
- Report Inappropriate Content
So are you looking for 4 lines on a same chart?
- Mark as New
- Bookmark
- Subscribe
- Mute
- Subscribe to RSS Feed
- Permalink
- Report Inappropriate Content
Hi Khyam,
Add a Qtr field to you load script:
Year (Date) & 'Q' & Ceil(Month (Date)/3) as Qtr,
For monthly variance of Qty create a line chart with dimension Month and these two expressions:
sum(Qty)
(sum(Qty)-RangeSum(Above(Qty,1,1)))/RangeSum(Above(Qty,1,1))
Fro the first expression de-select the 'Line' checkbox in the 'Display Options' part of the Expressions tab.
If you want to show the var in Value in the same chart add
sum(Value)
(sum(Value)-RangeSum(Above(Value,1,1)))/RangeSum(Above(Value,1,1))
As before de-select the 'Line' checkbox for the sum(Value) expression.
For the quarterly variance change the dimension to Qtr.
Hope this helps.
- Mark as New
- Bookmark
- Subscribe
- Mute
- Subscribe to RSS Feed
- Permalink
- Report Inappropriate Content
No separate for Months and Quarter
but I am concerned mainly with Months Chart should show variation in % from Jan to Dec (11 Data points)
Best Regards,
- Mark as New
- Bookmark
- Subscribe
- Mute
- Subscribe to RSS Feed
- Permalink
- Report Inappropriate Content
Hi Andrew,
Thanks for the reply.
Quarter was added successfully as field.
But the other part related to variation is not working.
Best Regards,
- Mark as New
- Bookmark
- Subscribe
- Mute
- Subscribe to RSS Feed
- Permalink
- Report Inappropriate Content
Hi Khyam,
Have a look at this qvw. It gives this chart for month comparison of qty. Nothing for Jan as no previous month data.
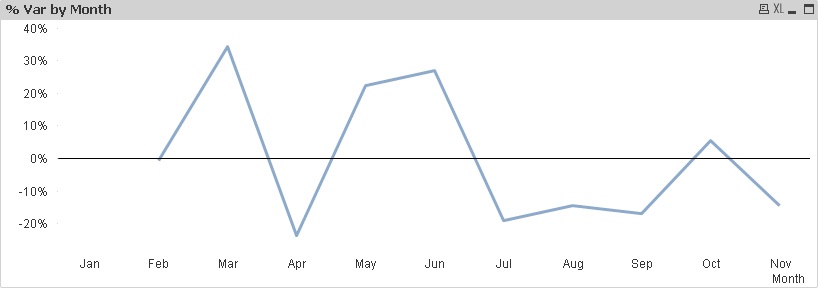
Dimension: Month
Expressions: sum(Qty)
(sum(Qty)-RangeSum(Above(Qty,1,1)))/RangeSum(Above(Qty,1,1))
the first expression is not shown by de-selecting the 'Line' display option
- Mark as New
- Bookmark
- Subscribe
- Mute
- Subscribe to RSS Feed
- Permalink
- Report Inappropriate Content
May be like this:
Expression: =(Sum(Qty)-Above(Sum(Qty)))/Above(Sum(Qty))
- Mark as New
- Bookmark
- Subscribe
- Mute
- Subscribe to RSS Feed
- Permalink
- Report Inappropriate Content
I have used this as second expression and unselected line option for Sum(Value) expression.
(sum(Value)-RangeSum(Above(Value,1,1)))/RangeSum(Above(Value,1,1))
its not working 
- Mark as New
- Bookmark
- Subscribe
- Mute
- Subscribe to RSS Feed
- Permalink
- Report Inappropriate Content
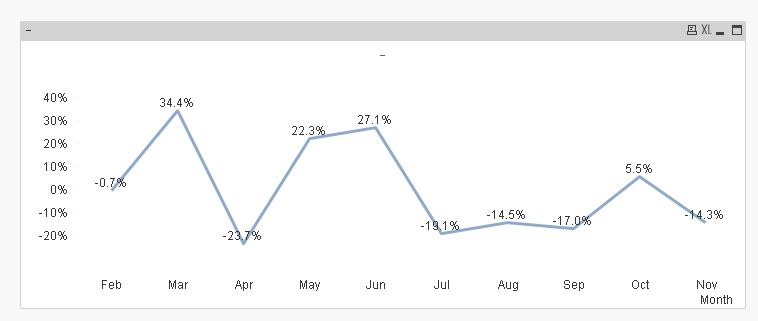
Thanks!
It is working.
But image is like this. what is missing???
- Mark as New
- Bookmark
- Subscribe
- Mute
- Subscribe to RSS Feed
- Permalink
- Report Inappropriate Content
How you want to see the image as?
- « Previous Replies
-
- 1
- 2
- Next Replies »